The residual social distancing in Italy during Phase 2
Authors:
Emanuele Pepe (1), Paolo Bajardi (1), Laetitia Gauvin (1), Filippo Privitera (2), Brennan Lake (2), Ciro Cattuto (1,3), Michele Tizzoni (1)
1. ISI Foundation
2. Cuebiq Inc.
3. University of Turin
Notice: this is preliminary analysis, has not yet been peer-reviewed and is updated daily as new data becomes available. This work is licensed under a Creative Commons Attribution 4.0 International License.
Background
The mitigation measures enacted as part of the response to the unfolding COVID-19 pandemic are unprecedented in their breadth and societal burden. A major challenge in this situation is to quantitatively assess the impact of non-pharmaceutical interventions like mobility restrictions and social distancing, to better understand the ensuing reduction of mobility flows, individual mobility changes, and impact on contact patterns. Here, we report preliminary results on tackling the above challenges by using de-identified, large-scale data from a location intelligence company, Cuebiq, that has instrumented smartphone apps with high-accuracy location-data collection software.
Italy has been severely affected by the COVID-19 pandemic, reporting the highest death toll in Europe as of April 2020. Following the identification of the first infections, on February 21, 2020, national authorities have put in place an increasing number of restrictions aimed at containing the outbreak and delaying the epidemic peak. On March 12, the government imposed a national lockdown. On May 4, the lockdown has been lifted and since May 18 most of business acitivities, especially in the retail sector, have restarted.
Here, analyze how mobility and proximity patterns in Italy have changed after the easing of the lockdown, at the sub-national scale.
Data
Mobility data is provided by Cuebiq, a location intelligence, and measurement platform. Through its Data for Good program, Cuebiq provides access to aggregated and privacy-safe mobility data for academic research and humanitarian initiatives. This first-party data is collected from anonymized users who have opted-in to provide access to their location data anonymously, through a GDPR-compliant framework.
Location is collected anonymously from opted in users through smartphone applications. At the device level, iOS and Android operating systems combine various location data sources (e.g. GPS, wifi, beacons, network) and provide geographical coordinates with a given level of accuracy. Location accuracy is determined by the device and is variable, but can be as accurate as 10 meters.
Temporal sampling of anonymized users’ location is also variable and dependent on app/OS characteristics and on user behavioral patterns, but it has a high-frequency overall. We remove short-time dynamics by aggregating the data over 5-minute windows. The basic unit of information we process is an event of the form (anonymous hashed user id, time, latitude, longitude), plus additional non-personal metadata and location accuracy.
For a more detailed description of the underlying data, please see the page Data.
Methods
From the original location data, we derive three epidemiologically relevant metrics of mobility and proximity that capture both long-range and short-range mobility patterns:
- the weekly origin-destination matrices measuring users’ movements between Italian provinces;
- the weekly users’ average radius of gyration by province, capturing the extent of individual movements;
- the daily average degree of users’ proximity network, capturing the level of social distancing by province.
All these metrics are computed by aggregating the original data sources in space and time in order to comply with privacy principles that ensure users cannot be re-identified, even indirectly, from the data.
A more detailed description of how these metrics have been generated can be found in the preprint:
Pepe, E., Bajardi, P., Gauvin, L., Privitera, F., Lake, B., Cattuto, C., & Tizzoni, M. (2020).
COVID-19 outbreak response: a first assessment of mobility changes in Italy following national lockdown.
medRxiv: https://www.medrxiv.org/content/10.1101/2020.03.22.20039933v1
Summary of results
At the national level, mobility patterns have continued increasing across the whole country, but still remain below the baseline levels (we consider the period from January 18 to February 21 as our baseline). This may be expected, since not all activities have restarted, schools are still closed, long-range mobility is still restricted.
Users’ movements between different provinces are now at -30%, on average, with respect to the baseline. The increase in mobility has mainly occurred between provinces within the same regions since mobility between diffrent regions is still restricted. During the lockdown, the largest average reduction observed was -71% at the national level. In the following, we consider the week of March 23-29, as the most representative of the lockdown, when the most restrictive policies were enforced in full (closure of several industries).
The median radius of gyration has increased in all provinces. On average, the radius of gyration has reached levels that are -55% below baseline. During the lockdown, the largest average reduction observed was -91%.
The average degree of the proximity network, at the national level, has reached levels equal to -17% with respect to the baseline. Such values are similar to those observed immediately after the beginning of the outbreak, on February 21-25. If the general trend persists, the average degree of the proximity network may return to baseline levels in a few weeks.
While the radius of gyration has remained at low levels, the degree of the proximity network has increased more quickly, suggesting that lifting the lockdown has led to an increase in short-range mobility rather than in long-range mobility.
Movements between provinces
The figure below compares the weekly fraction of users traveling out of the Italian provinces during the lockdown (left) and in the week of May 15-22 (right). In several provinces, outgoing movements have reached volumes only 15% below the baseline or more: for instance, Lodi, Prato, Rovigo, Padova, Enna.
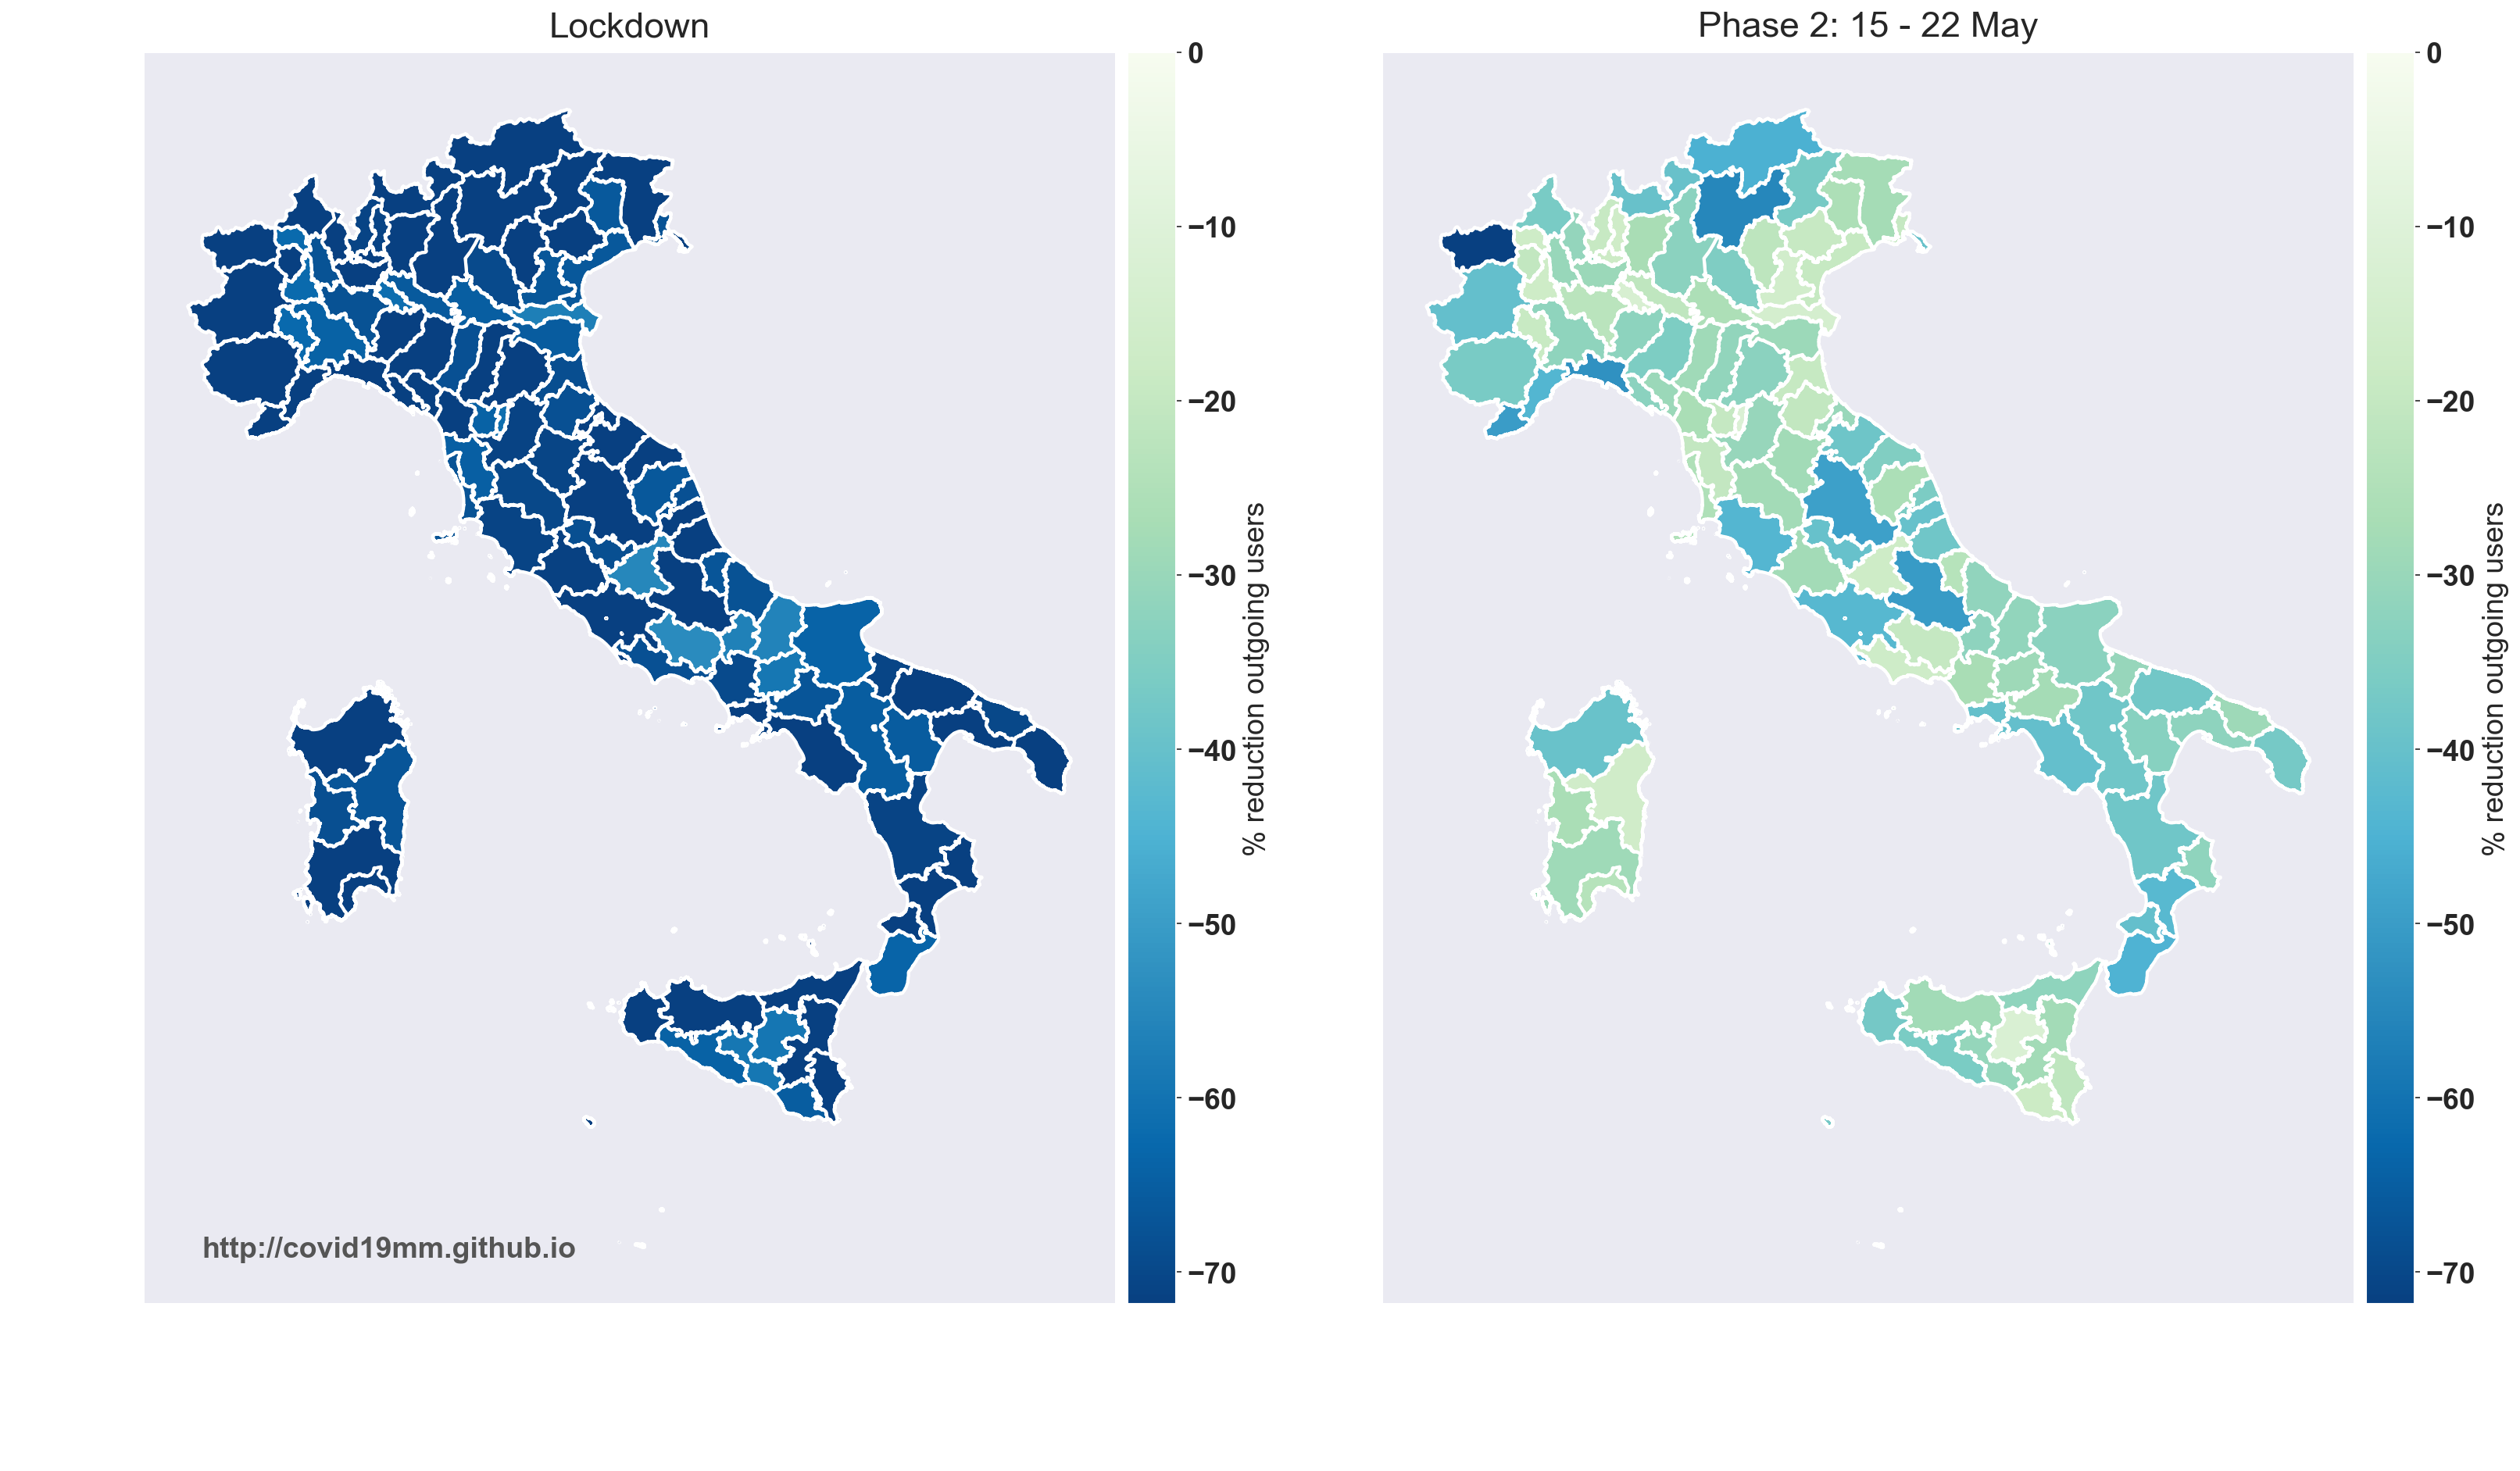
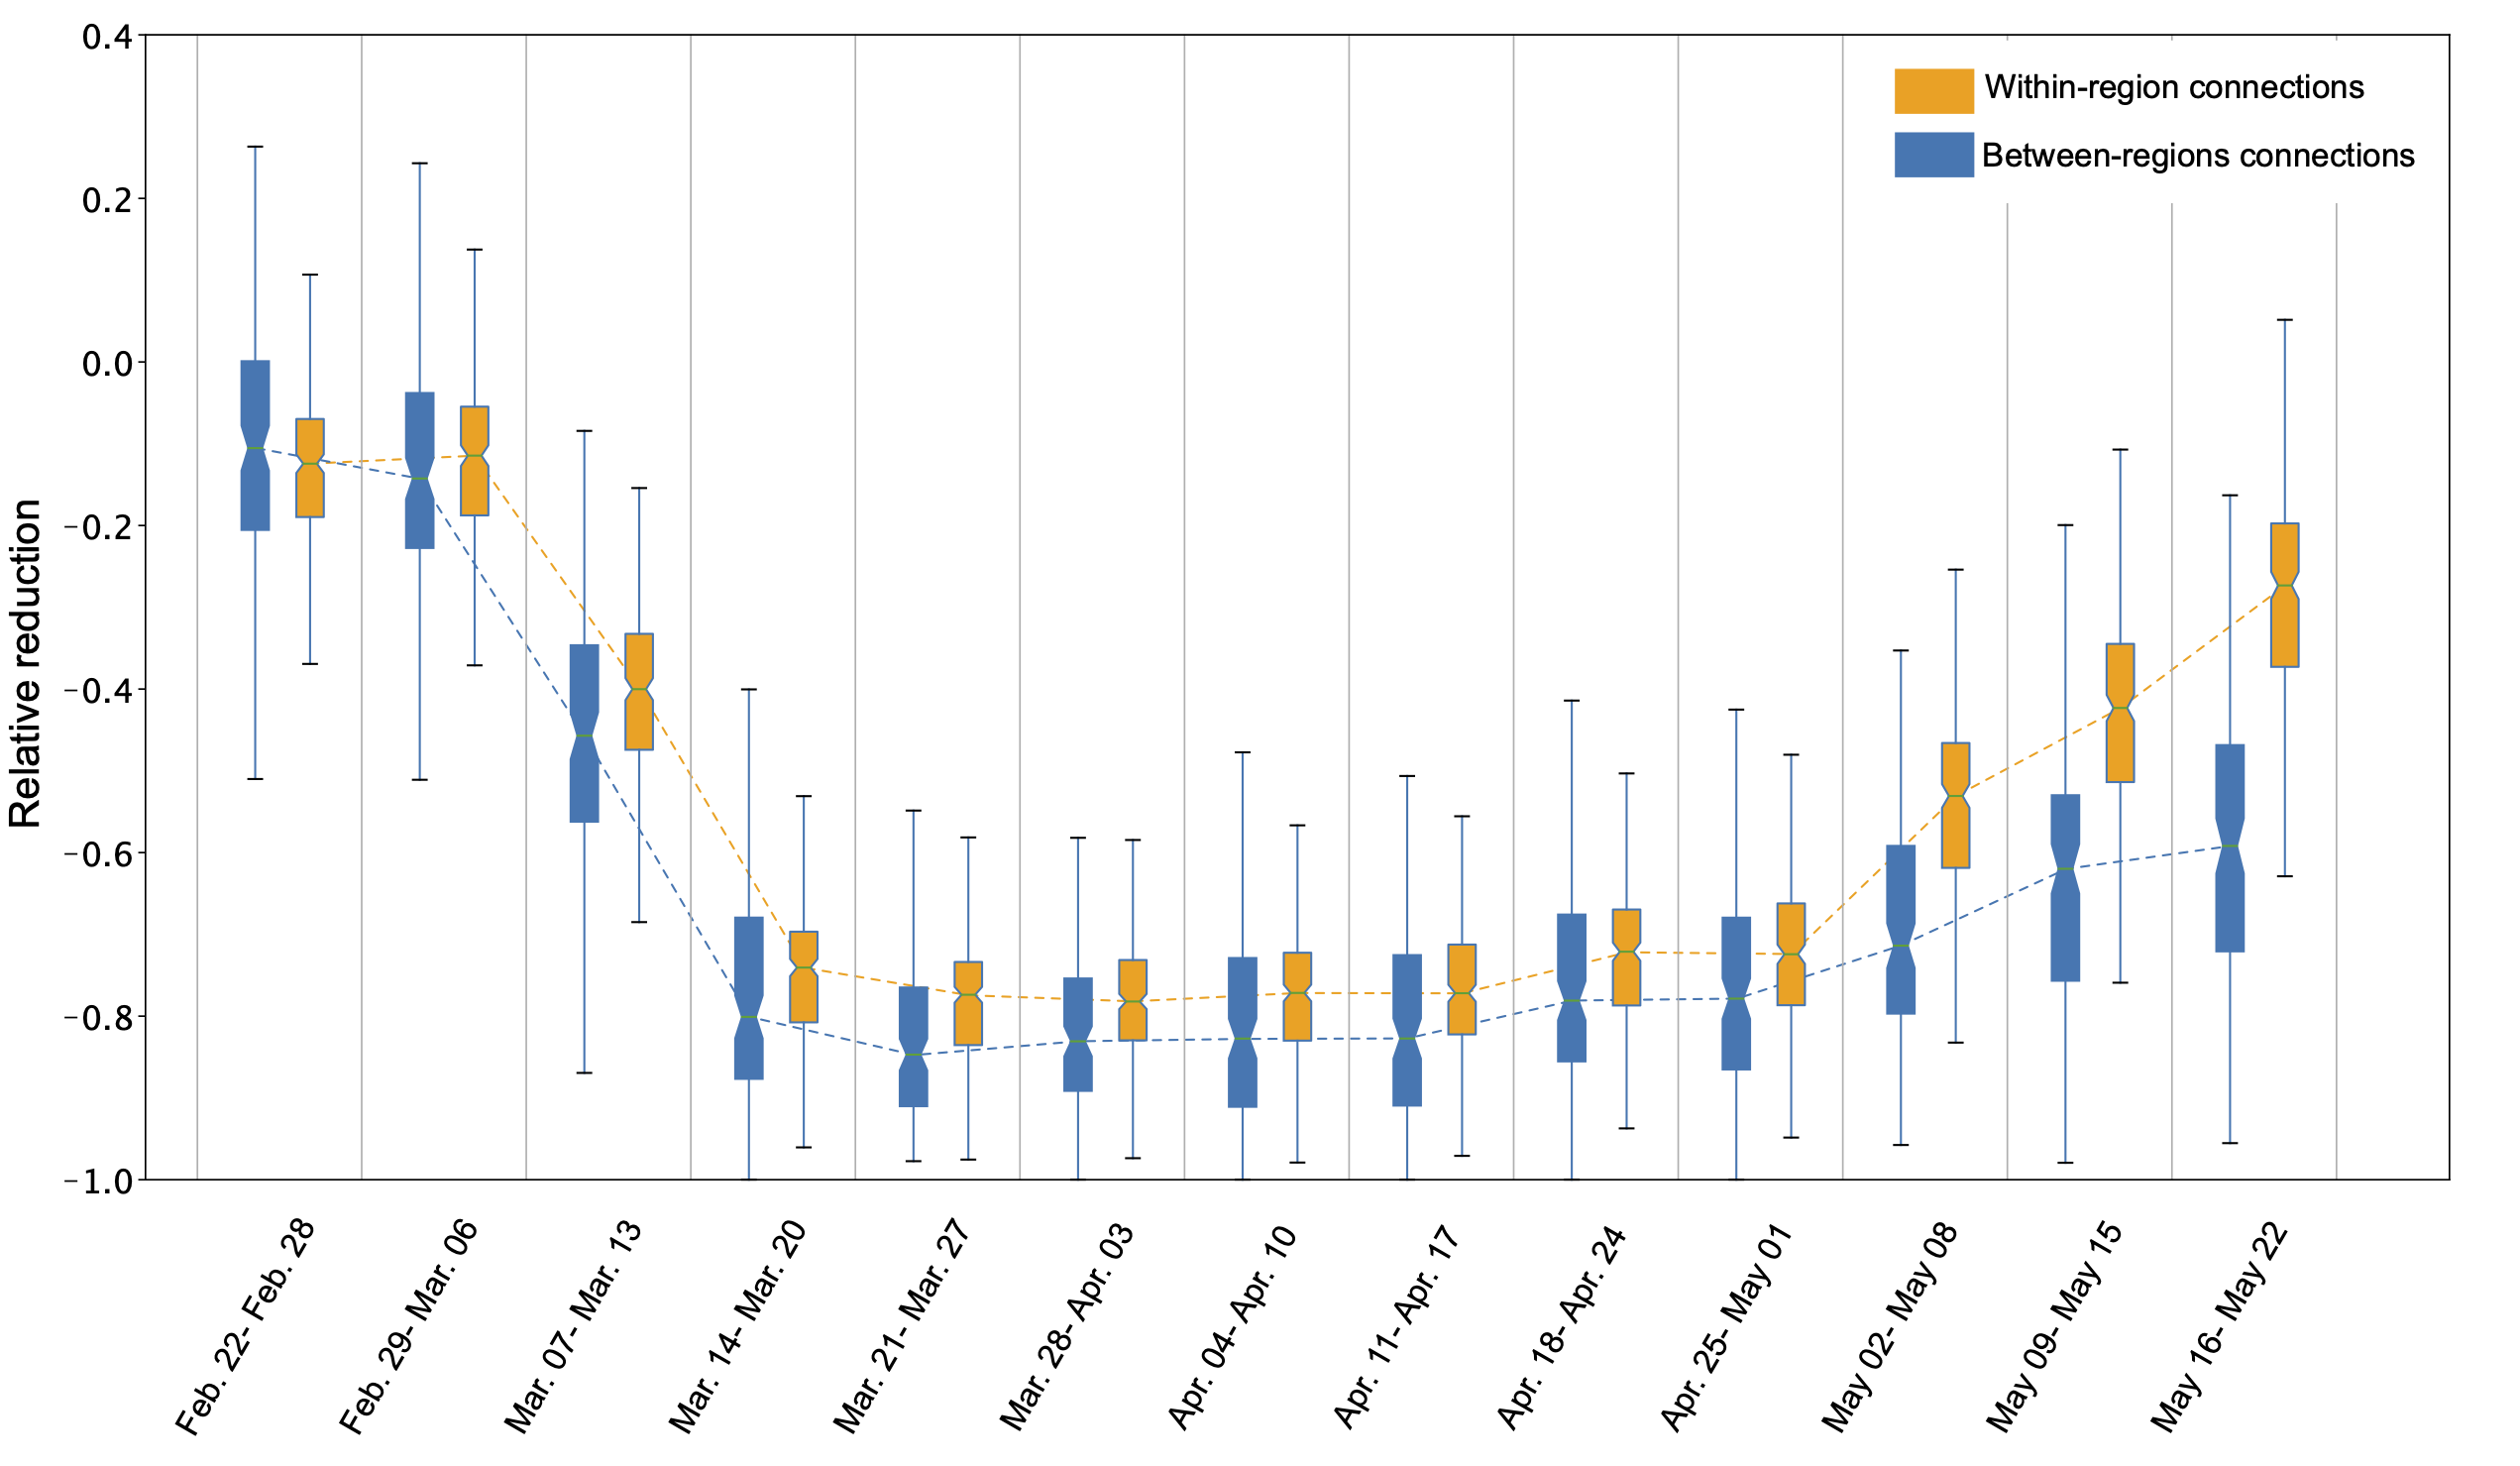
Movements between provinces have not increased uniformly across the country. Mobility between provinces of the same region has steadily increased and in some cases, on specific connections, movements have reached the baseline levels. Overall, the median of users’ movements on connections within the same region has increased from -77% during the lockdown to -27%. The median of users’ movements on connections between provinces of different regions has increased from -85% during the lockdown to -60%.
The table below shows the 10 connections with the largest increse in mobility in the week of May 15 - 22. Notably, movements between Padova and Rovigo, Biella and Vercelli, are now slightly above the baseline levels.
| Province of Origin | Province of Destination | Lockdown reduction | Reduction May 2 - 8 | Reduction May 15 - 22 |
|---|---|---|---|---|
| Padova | Rovigo | -69% | -27% | +7% |
| Rovigo | Padova | -68% | -35% | -1% |
| Biella | Vercelli | -68% | -37% | +5% |
| Vercelli | Biella | -67% | -38% | -6% |
| Asti | Alessandria | -55% | -33% | +0% |
| Alessandria | Asti | -52% | -29% | -3% |
| Pistoia | Prato | -69% | -43% | -4% |
| Prato | Pistoia | -68% | -40% | -6% |
| Udine | Pordenone | -72% | -41% | -4% |
| Pordenone | Udine | -72% | -40% | -5% |
The table below shows the 10 connections with the smallest increase in mobility during the of May 15-22.
| Province of Origin | Province of Destination | Lockdown reduction | Reduction May 2 - 8 | Reduction May 15 - 22 |
|---|---|---|---|---|
| Torino | Milano | -94% | -80% | -84% |
| Milano | Torino | -94% | -82% | -83% |
| Trento | Brescia | -89% | -79% | -80% |
| Brescia | Trento | -91% | -80% | -75% |
| Aosta | Torino | -88% | -71% | -66% |
| Torino | Aosta | -89% | -72% | -64% |
| Trento | Verona | -85% | -75% | -65% |
| Verona | Trento | -88% | -75% | -64% |
| Genova | Alessandria | -81% | -72% | -65% |
| Alessandria | Genova | -82% | -73% | -63% |
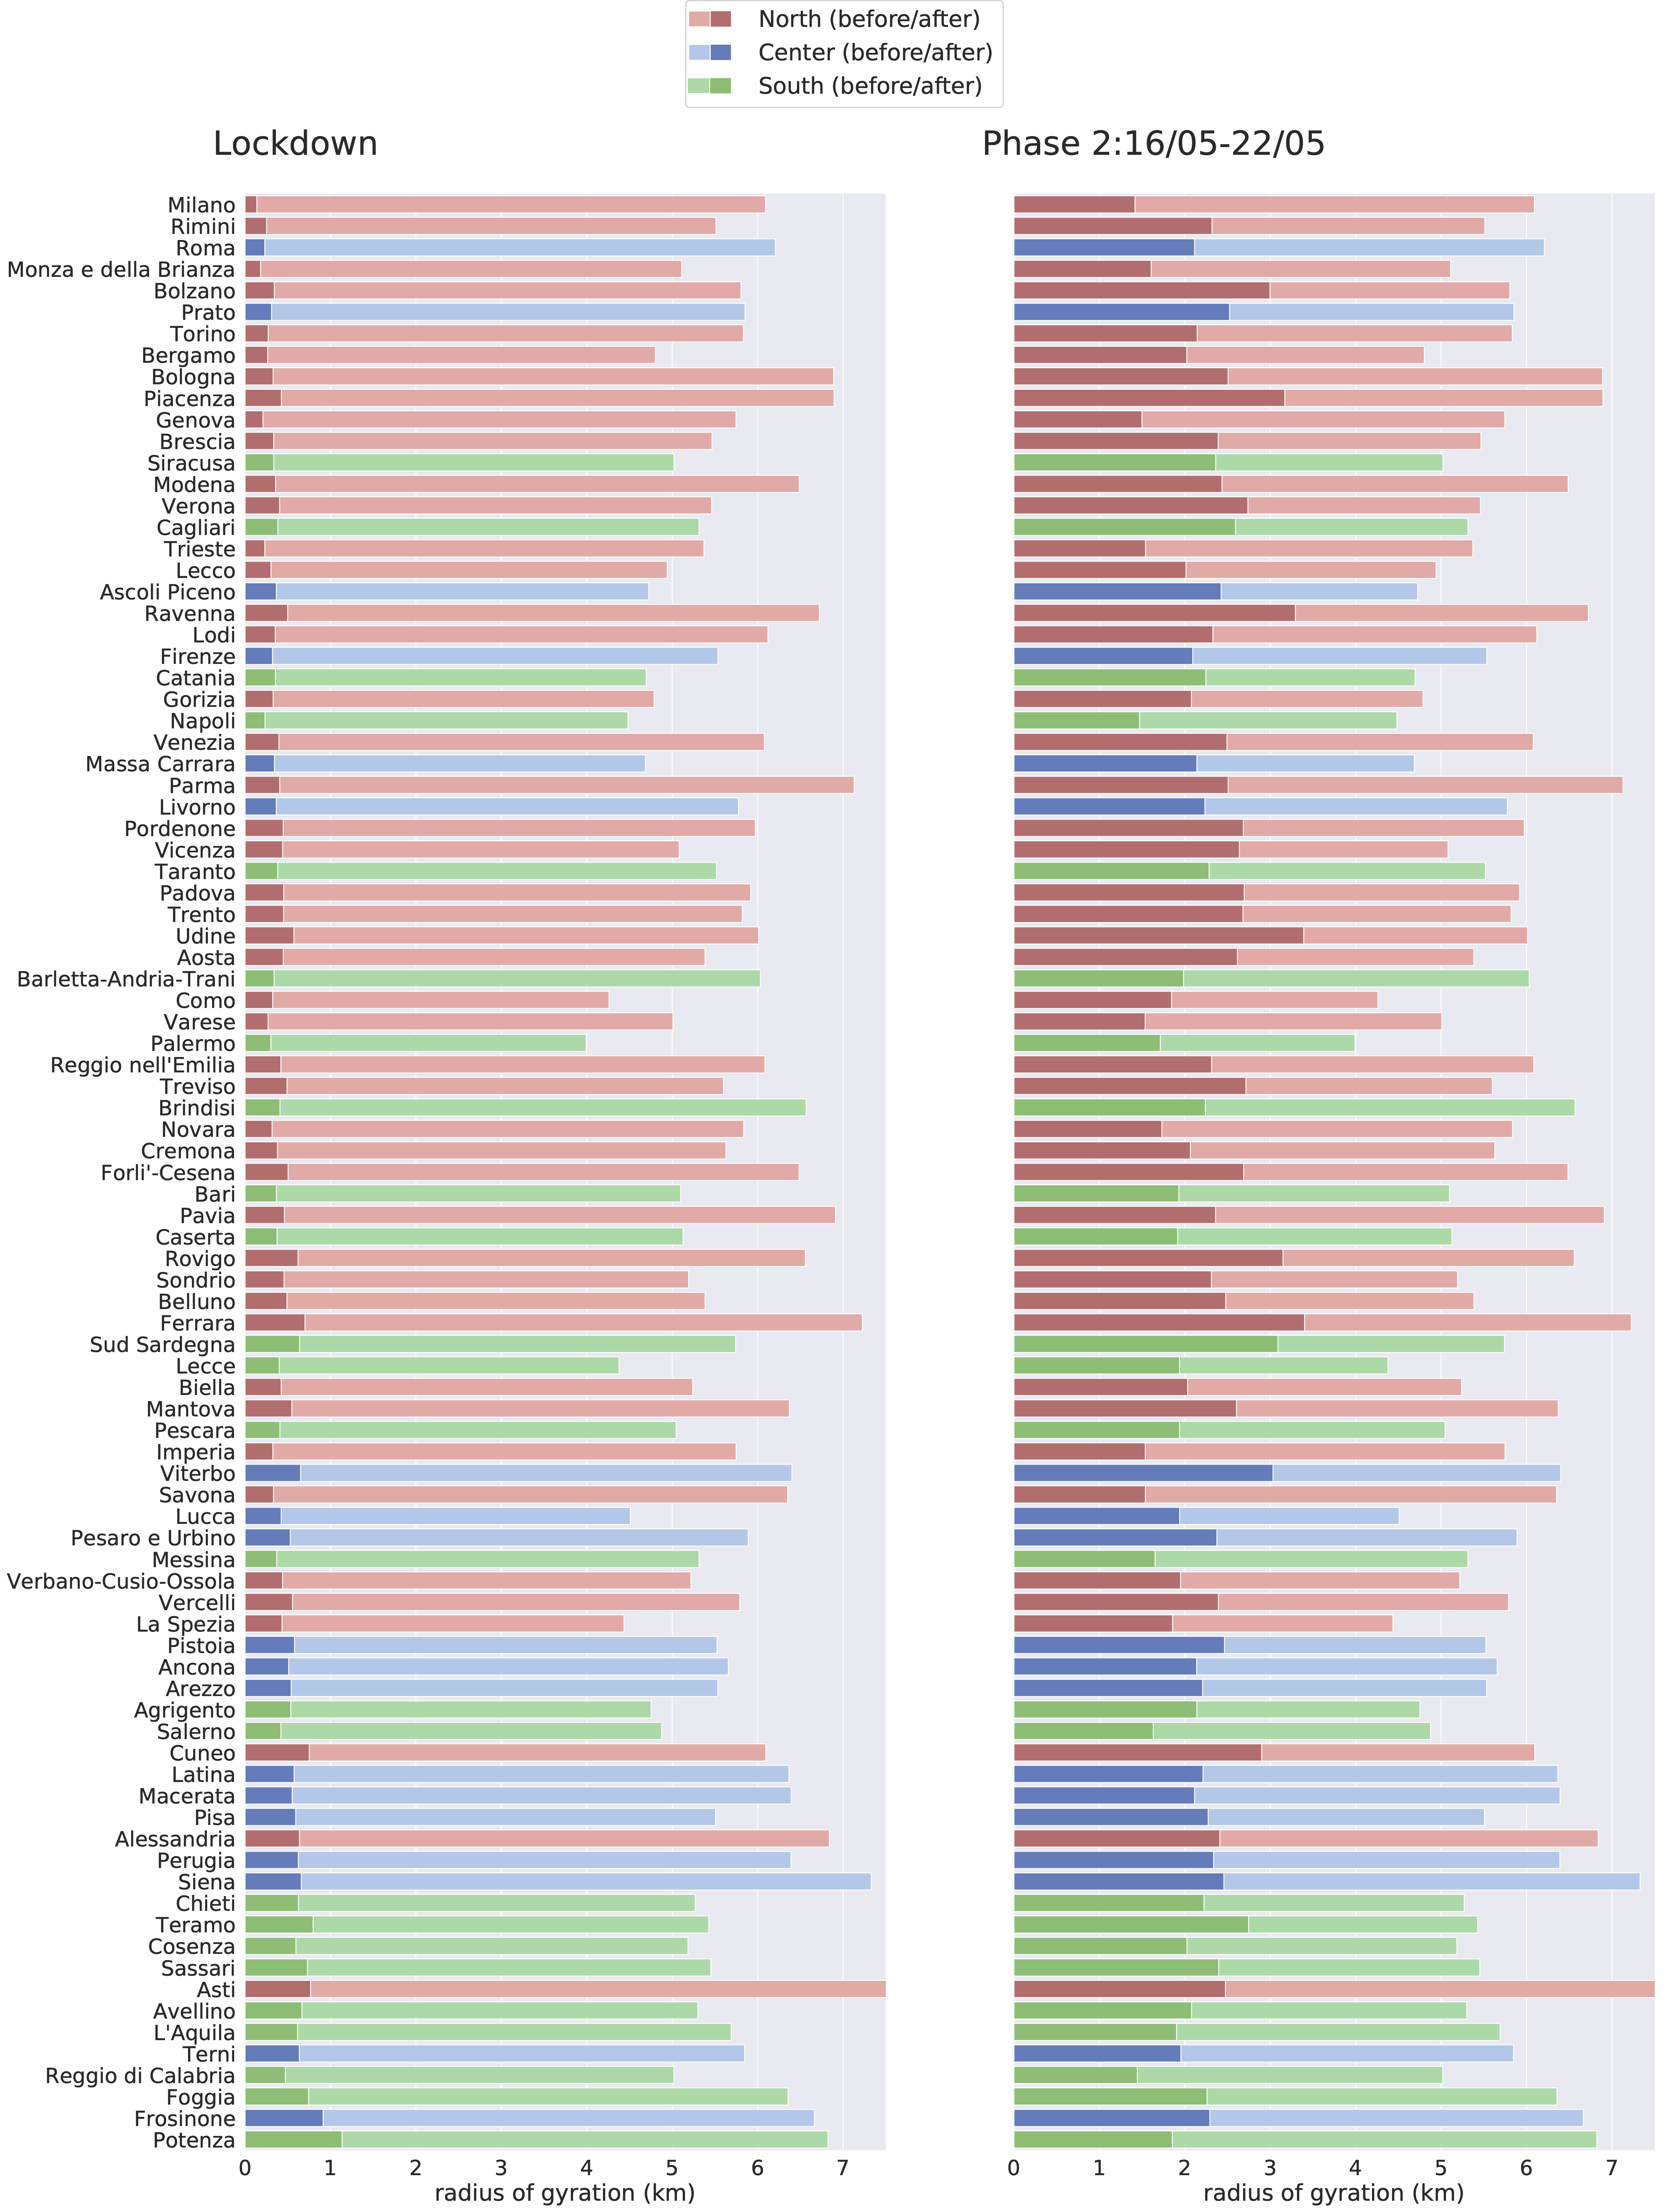
Radius of gyration
The figure below compares the median weekly radius of gyration of our users by province, during the lockdown (left) and in the week of May 15 -22 (right). The shaded bar indicates the baseline median values. Provinces are ranked by the relative increase of the radius of gyration during Phase 2, with respect to the lockdown, from the largest (top) to the smallest (bottom).
The median radius of gyration has further increased since the first week of Phase 2, but still remains on average at -56% below the baseline values. In the past week, we observed big relative increases of the radius of gyration in large urban areas like Milano, Roma, and Torino.
Proximity network
The average degree of the proximity network, <k>, has furhter increased in the past week everywhere in Italy.
Overall, the values of <k> remained below the baseline levels but grew quickly, especially in the South.
In the week of May 15-22, the average degree has increased to -21% below baseline in the North, -15% in the Center and -7% in the South.
As we reported during the lockdown, on April 12, Easter Day, the average degree of all users was 86% lower than the pre-outbreak averages in the North, 83% in the Center and 82% in the South and the Islands. Thus, the density of the proximity network has increased significantly more in the South and in the Center than in the North.
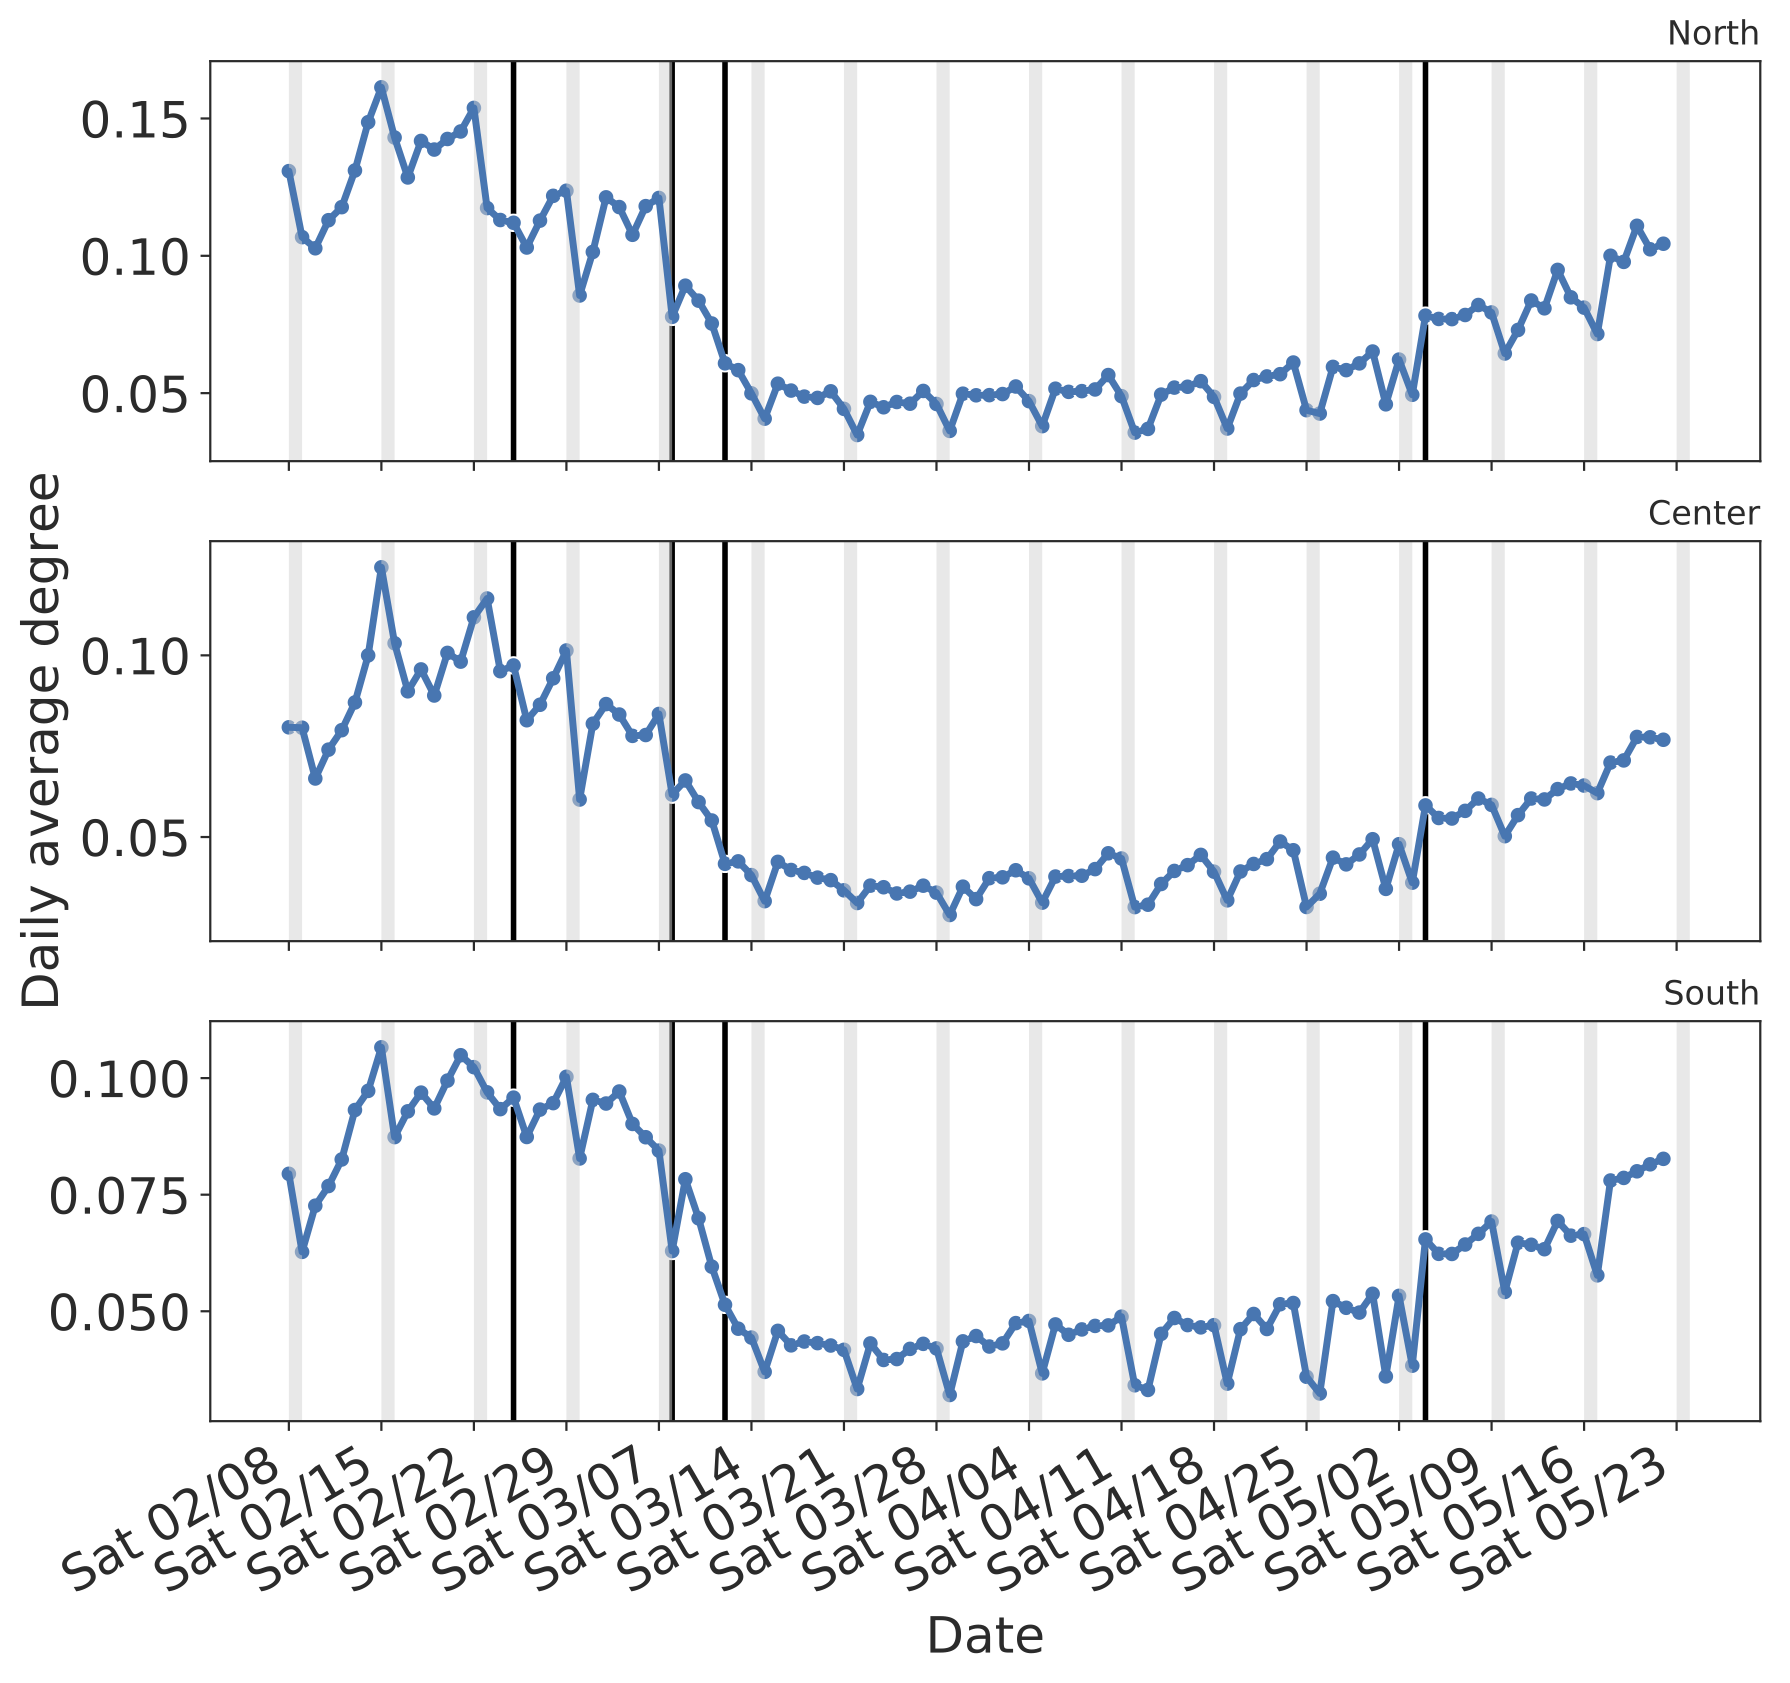
It is worth noticing how the degree of proximity did not decrease much during weekends as it used to during the lockdown. This is a clear indicator of social activities restarting during leisure time. The difference observed in weekends during the lockdown and after the lift is particularly evident in the Center and the South.
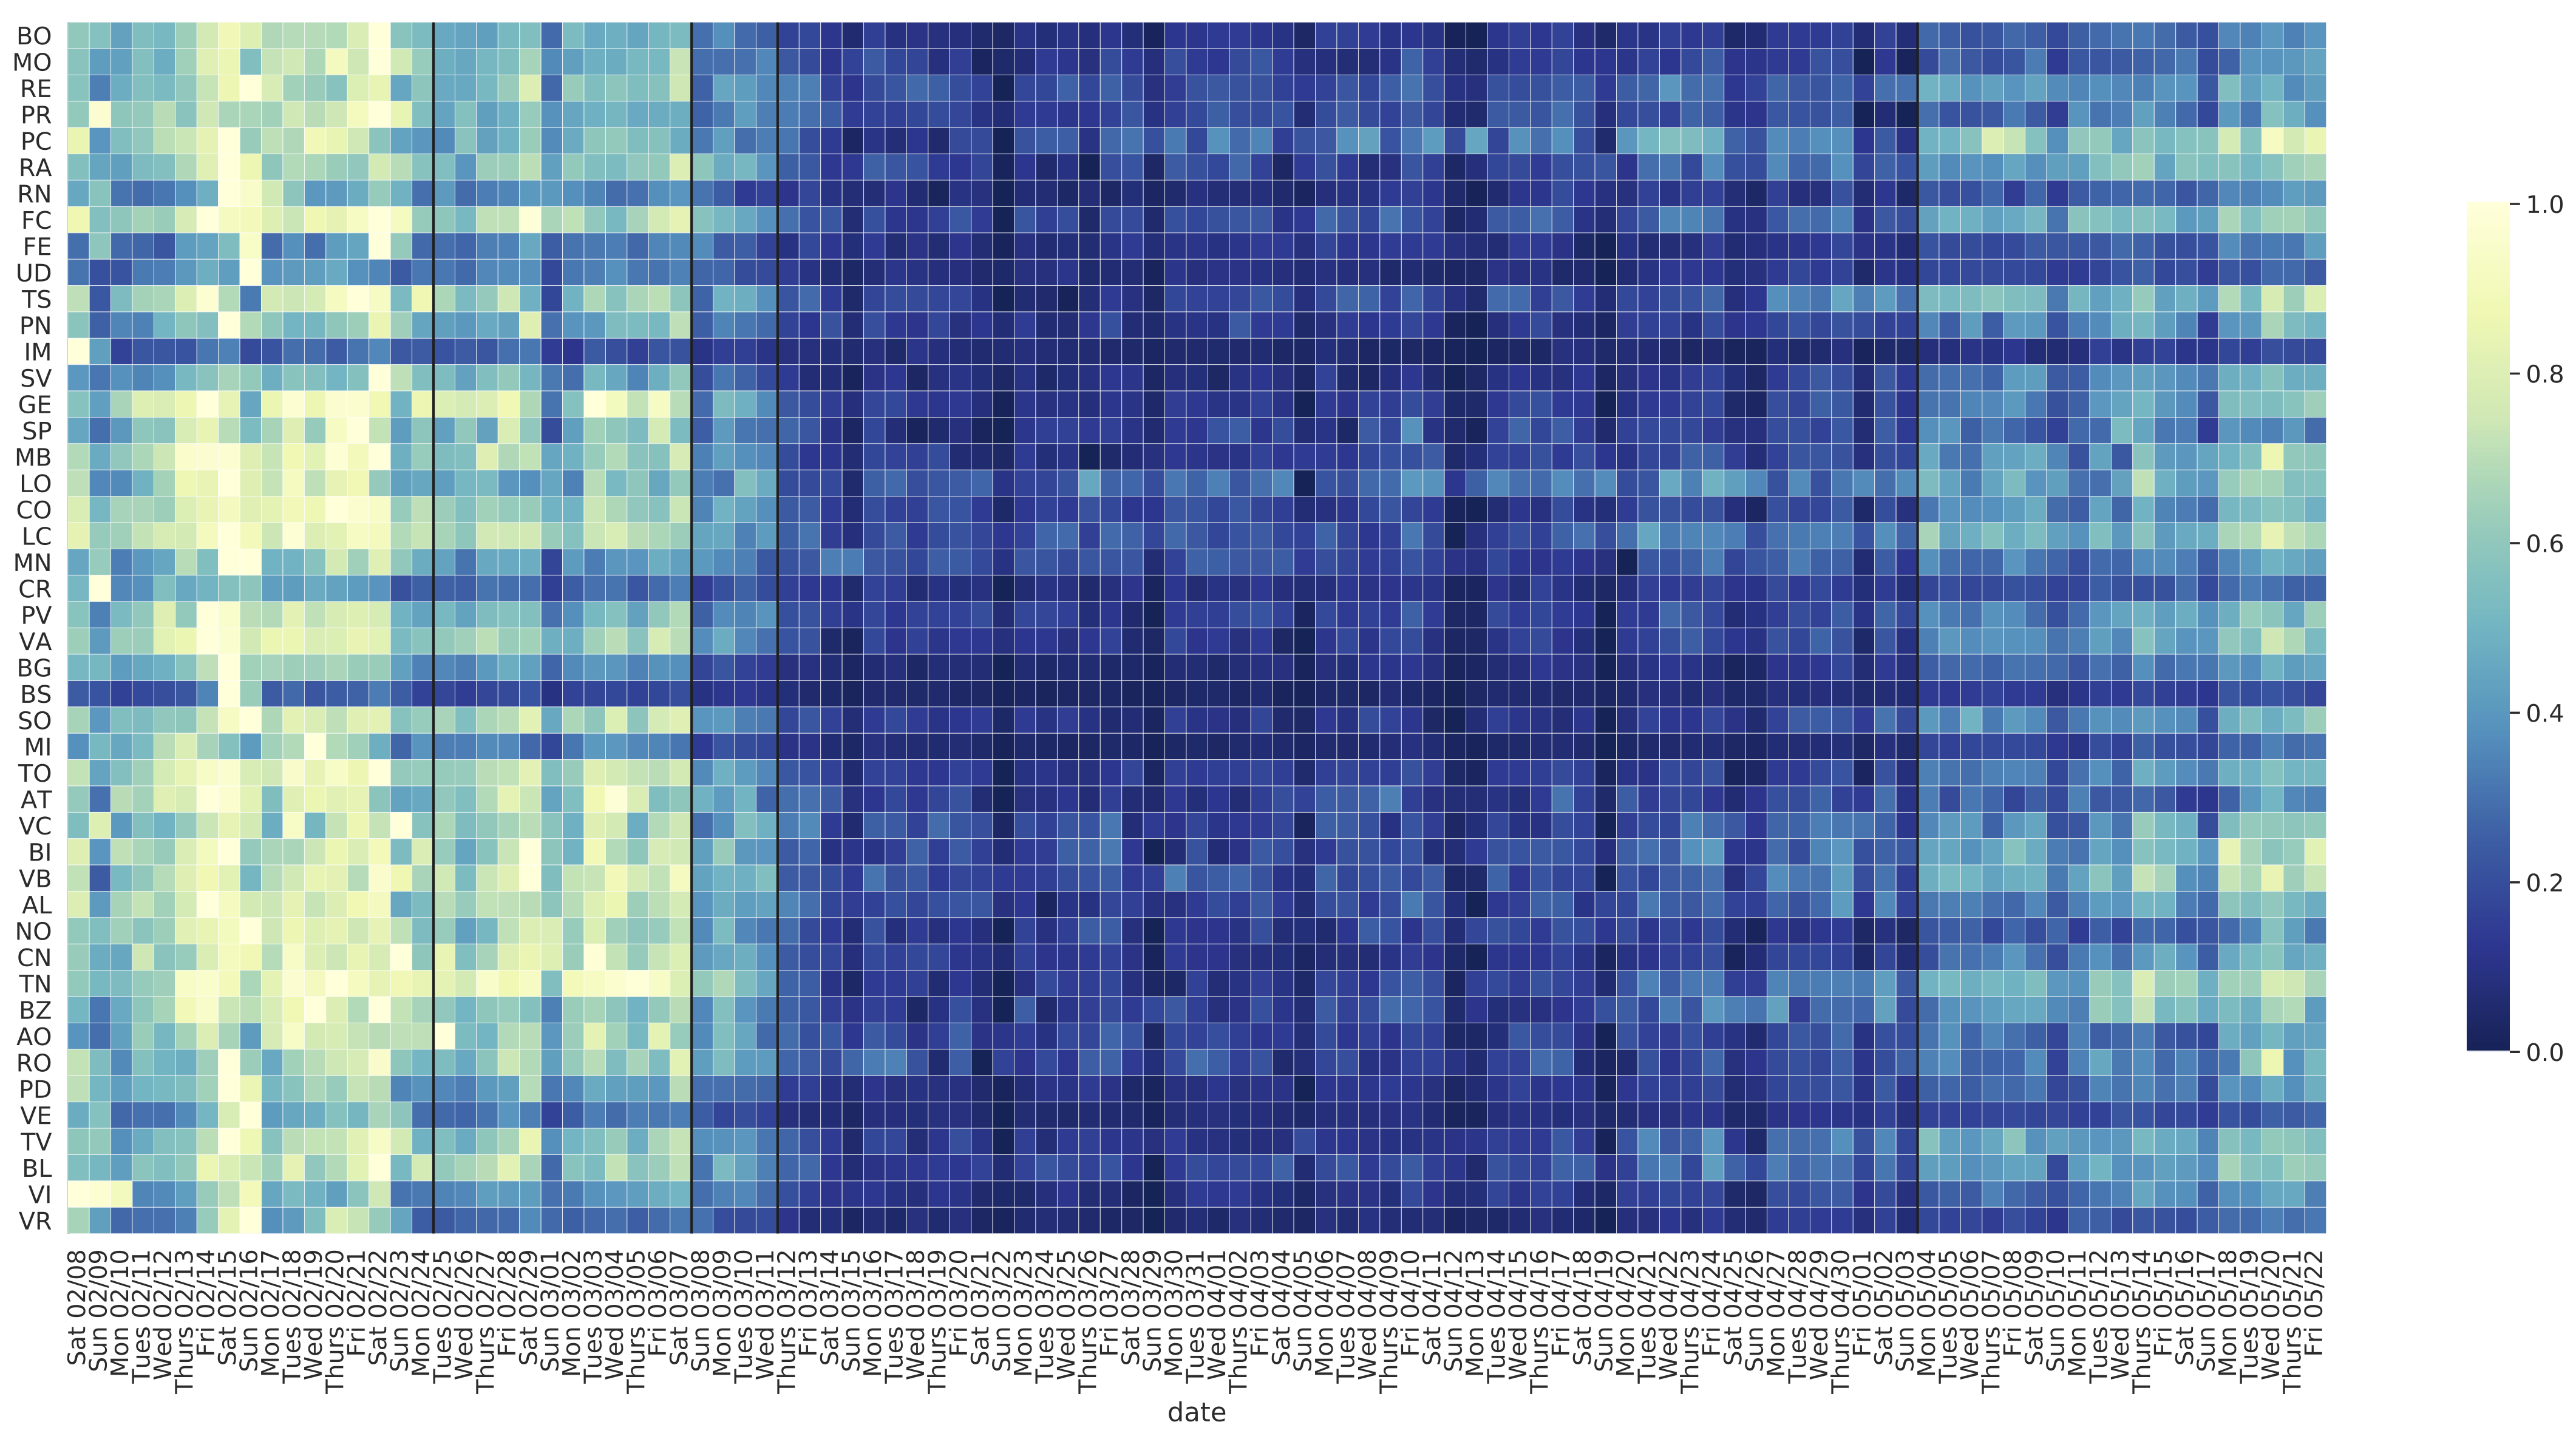
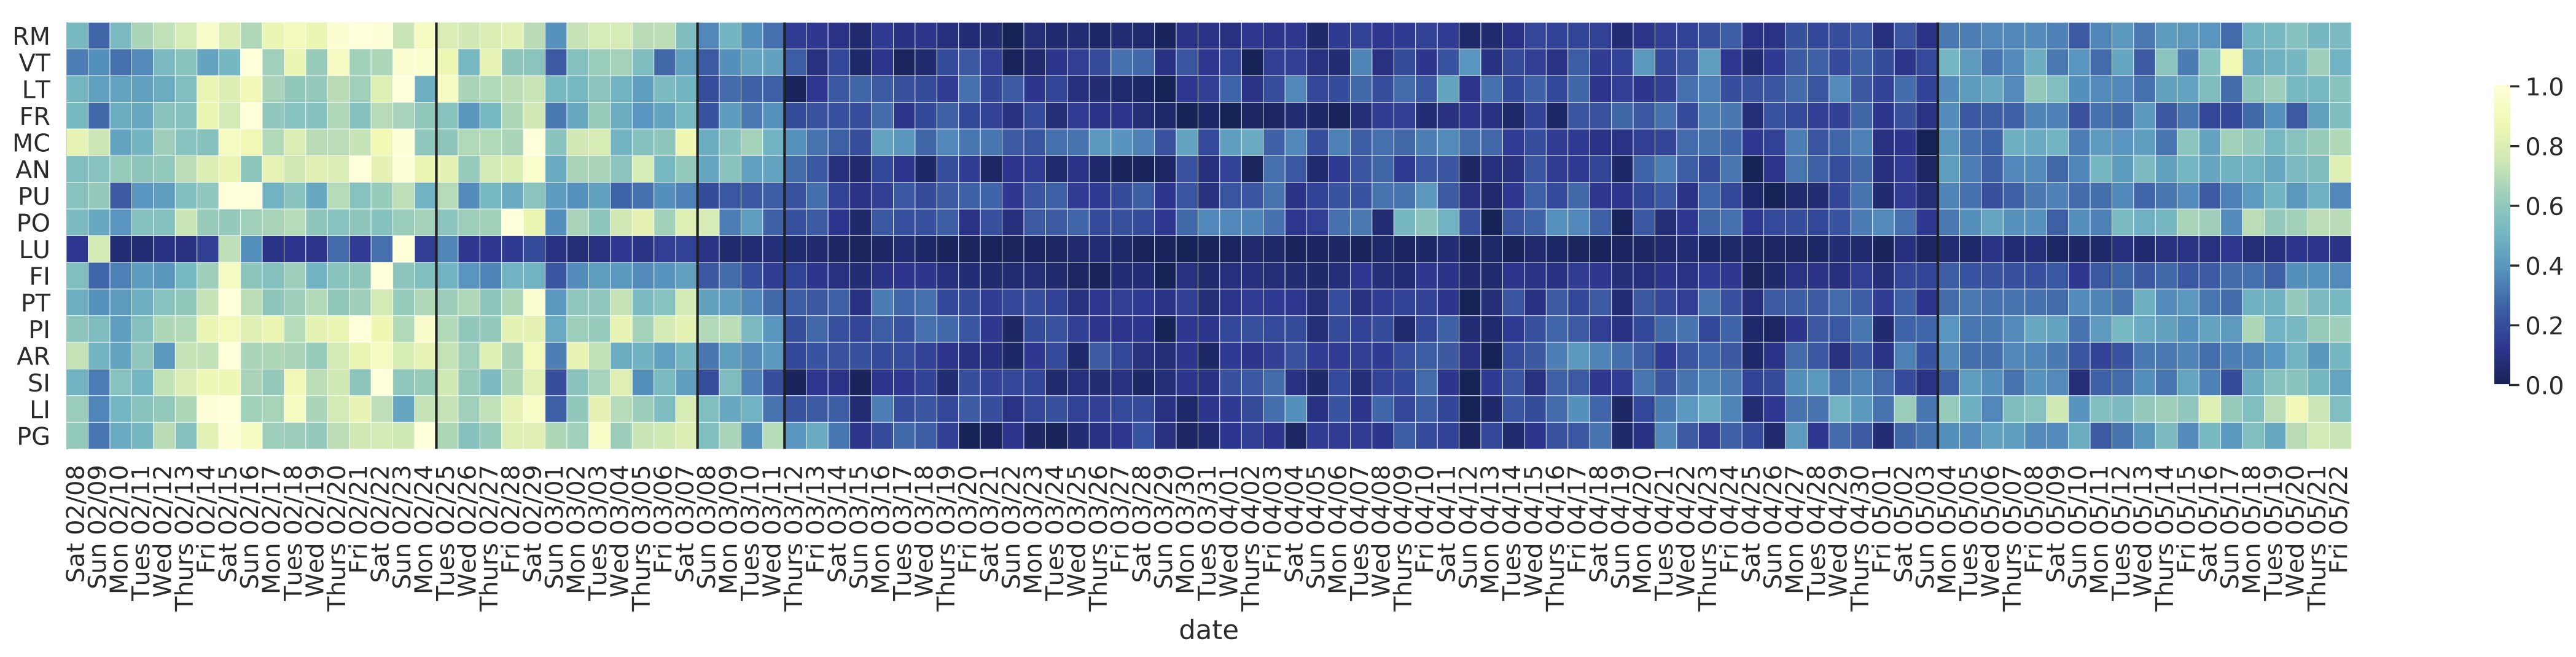
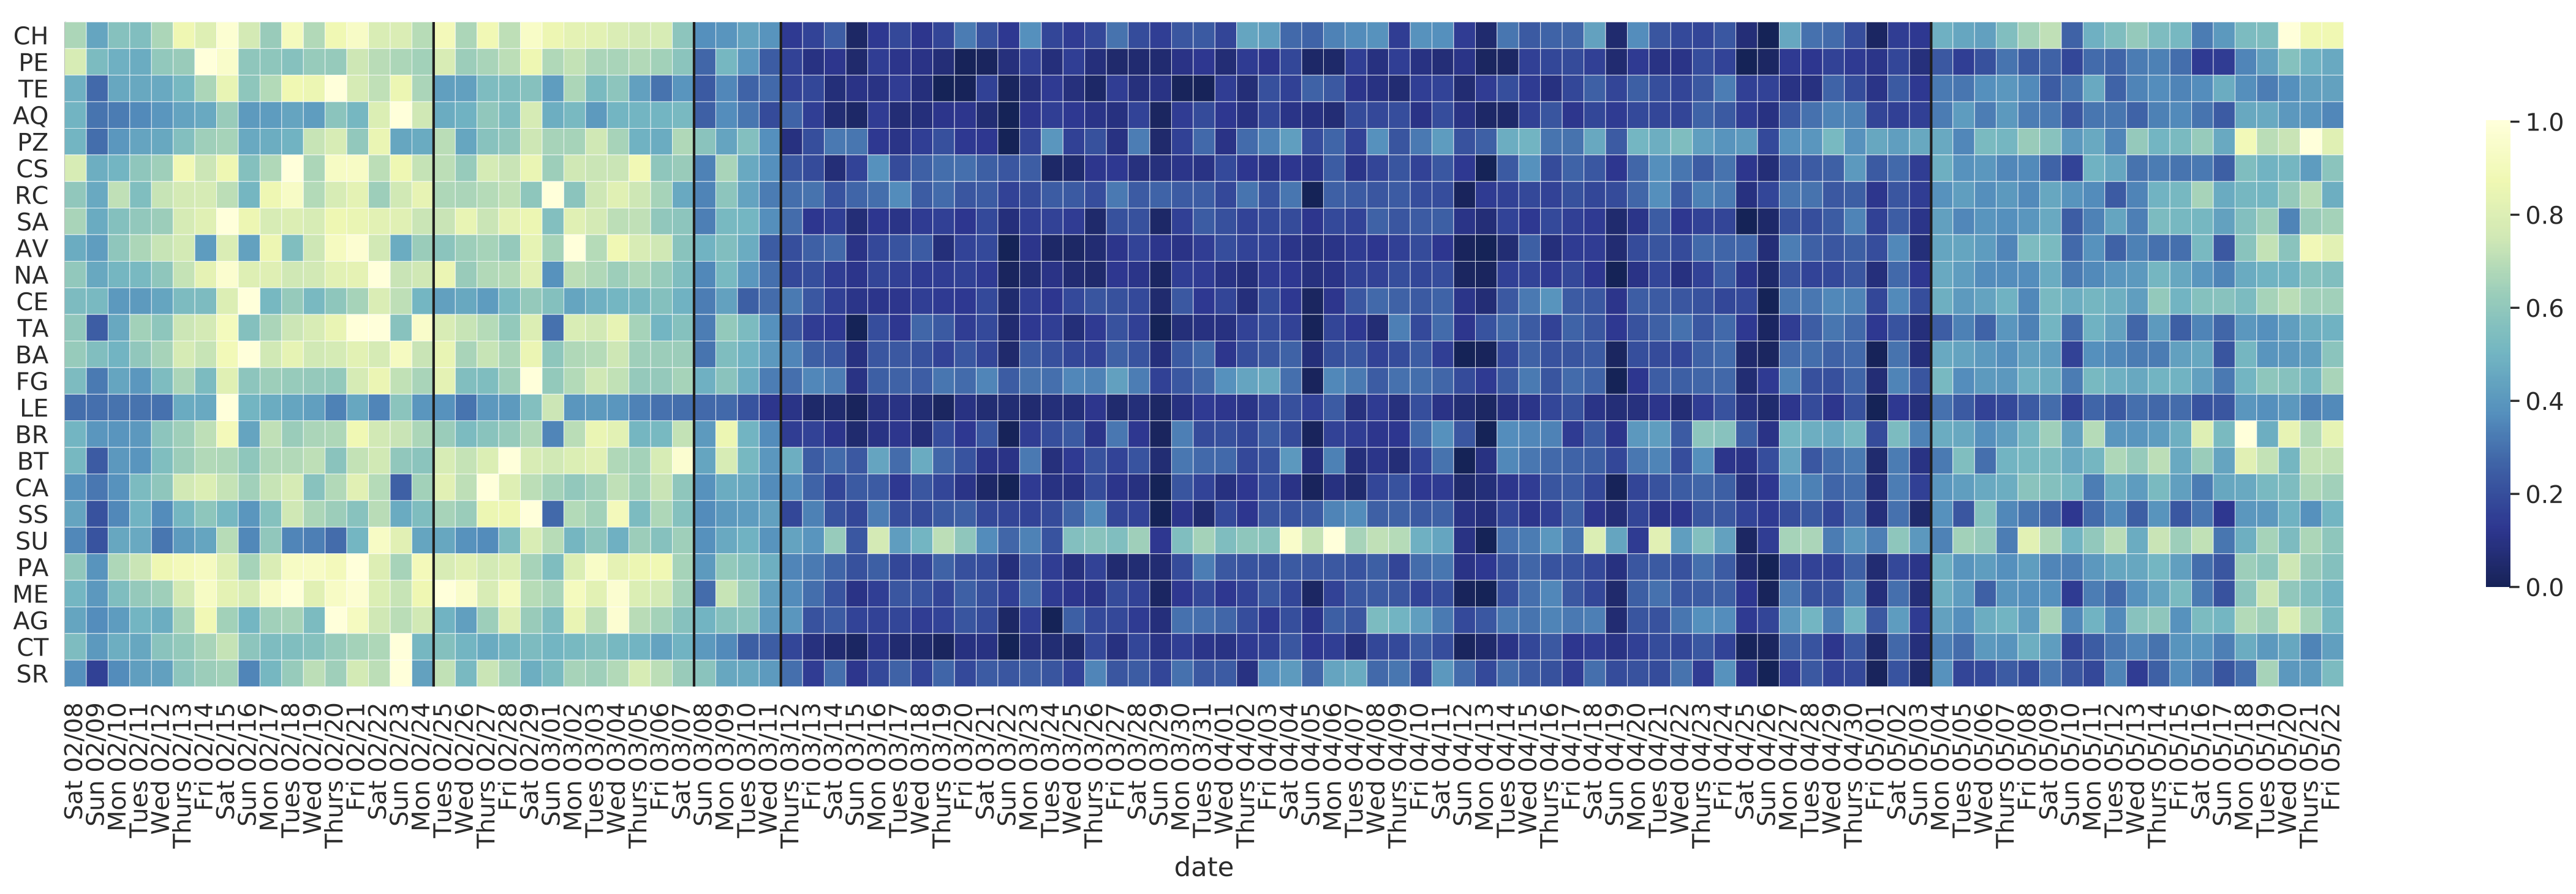
The heatmaps below show the time evolution of the average degree of the proximity network by province.
Northern Italy
Central Italy
Southern Italy
Data Protection
This research was solely based on data from anonymized users who have opted-in to provide access to their location data anonymously, through a GDPR-compliant framework. The analysis never singled out identifiable individuals and no attempts were made to link these data to third party data about an individual. In order to preserve privacy, residential areas are inferred at an aggregated geohash level, thereby allowing for demographic analysis while obfuscating the true home location of anonymous users and prohibiting misuse of data.
Acknowledgments and Partnerships
This preliminary analysis is a collaboration between the ISI Foundation and Cuebiq Inc. Authors at ISI Foundation acknowledge support from the Lagrange Project funded by CRT Foundation and thank Cuebiq for access to a de-identified sample of its mobility data. In response to the COVID-19 crisis, Cuebiq is providing insights to academic and humanitarian groups through a multi-stakeholder data collaborative for timely and ethical analysis of aggregate human mobility patterns.