COVID-19 outbreak response: first assessment of mobility changes in Italy following lockdown
Authors:
Emanuele Pepe (1), Paolo Bajardi (1), Laetitia Gauvin (1), Filippo Privitera (2), Ciro Cattuto (1,3), Michele Tizzoni (1)
1. ISI Foundation
2. Cuebiq Inc.
3. University of Turin
Notice: this is preliminary analysis, has not yet been peer-reviewed and is updated daily as new data becomes available. This work is licensed under a Creative Commons Attribution 4.0 International License.
Background
The mitigation measures enacted as part of the response to the unfolding SARS-CoV-2 pandemic are unprecedented in their breadth and societal burden. A major challenge in this situation is to quantitatively assess the impact of non-pharmaceutical interventions like mobility restrictions and social distancing, to better understand the ensuing reduction of mobility flows, individual mobility changes, and impact on contact patterns. Here we report preliminary results on tackling the above challenges by using de-identified, large-scale data from a location intelligence company, Cuebiq, that has instrumented smartphone apps with high-accuracy location-data collection software. We focus this initial analysis on Italy, where the COVID-19 epidemic has already triggered an unprecedented and escalating series of restrictions on travel and individual mobility of citizens.
Data
Mobility data is provided by Cuebiq, a location intelligence, and measurement platform. Through its Data for Good program, Cuebiq provides access to aggregated and privacy-safe mobility data for academic research and humanitarian initiatives. This first-party data is collected from anonymized users who have opted-in to provide access to their location data anonymously, through a GDPR-compliant framework.
Location is collected anonymously from opted in users through smartphone applications. At the device level, iOS and Android operating systems combine various location data sources (e.g. GPS, wifi, beacons, network) and provide geographical coordinates with a given level of accuracy. Location accuracy is determined by the device and is variable, but can be as accurate as 10 meters.
Temporal sampling of anonymized users’ location is also variable and dependent on app/OS characteristics and on user behavioral patterns, but it has a high-frequency overall. We remove short-time dynamics by aggregating the data over 5-minute windows. The basic unit of information we process is an event of the form (anonymous hashed user id, time, latitude, longitude), plus additional non-personal metadata and location accuracy.
We selected a panel of users who were active during the first week of the outbreak (February 22-28, 2020). This leads to a sample of about 170k users with a total of about 175 million data points over the 8 weeks of study.
Timeline
The COVID-19 outbreak was declared by the WHO a Public Health Emergency of International Concern on 30 January 2020 and since then, it has infected more than 125,000 cases in 114 countries, reaching pandemic proportions.
Following the first local sustained transmission in Italy, the national government put in place an increasing number of policies aimed at containing the local outbreaks and subsequently to mitigate the sustained transmission and delay the epidemic peak. The policies introduced between the end of February and the first week of March 2020 ranged from school closure, advise against traveling or even ban any non-authorized displacement towards and from areas with sustained local transmission, suspension of school trips and public events, closure of museums, increasing restrictions for the opening hours of restaurants and bars and enforcing of smart/remote working among others.
Almost every day from February 25th to March 9th novel and stricter policies were declared in an increasing number of Italian provinces. In the following a brief timeline of the main facts and policies implemented are reported:
-
February 18th, 2020: the first local transmission was observed in Codogno (Lodi province).
-
February 23rd, 2020: Restriction to access and leave all the municipalities where local outbreaks were observed, 10 of them are located in Lodi province (Lombardia) and 1 of them is located in Padova province (Veneto). Schools were closed, and all public events at the regional level (Lombardia and Veneto) were suspended as well.
-
February 25th, 2020: School closure and public events are suspended in Lombardia, Veneto, Emilia Romagna, Friuli Venezia Giulia, Piemonte and Liguria. All school trips are suspended at the national level. Mild measures to limit access to schools to students that have been sick for longer than 5 days were implemented at the national level.
-
March 8th, 2020: Restriction to access and leave all the provinces in Lombardia region plus the Modena, Parma, Piacenza, Reggio nell’Emilia, Rimini, Pesaro e Urbino, Alessandria, Asti, Novara, Verbano-CusioOssola, Vercelli, Padova, Treviso, Venezia provinces.
-
March 9th, 2020: People are asked to remain home in the entire country: a national lockdown is declared
-
March 12th, 2020: all the restaurants and shops must remain closed in the entire country.
Summary of results
We are able to assess in near real-time the effects of public health policies on the mobility patterns and social mixing in Italy, by measuring:
-
changes in the traffic fluxes between provinces
-
changes in the average distance traveled by users
-
changes in the spatial proximity of users
We estimate the effects of the interventions during the first three weeks since the start of the outbreak (February 18, 2020):
-
Week 1: from February 22 to February 28, when first restrictions were introduced in the area of the initial outbreak.
-
Week 2: from February 29 to March 6, when restrictions are extended to the North of Italy.
-
Week 3: from March 7 to March 10 - National lockdown.
To do so we average different mobility and proximity metrics during the pre-outbreak period (between January 18 and February 19, 2020) and observe their weekly and daily evolution, in real-time, as the intervention policies are enforced.
Our key results can be summarized as follows:
-
The initial mobility restrictions targeted at Lombardy, Veneto, and Emilia-Romagna have led to a reduction ranging between 10% and 30% of the traffic between Italian provinces during weeks 1 and 2.
-
Following the national lockdown of March 9, the mobility fluxes between provinces have decreased by 50% or more, everywhere in the country.
-
Following the national lockdown, the number of users who did not leave their home province after March 9, has increased by an average of 50% at the national level and more than 100% in the provinces of Lodi, Piacenza, Fermo, and Vercelli, with respect to the pre-outbreak period.
-
The characteristic distance traveled by users considerably reduced over the 3 weeks of restrictions. Indeed, the average radius of gyration of the users distributed all over Italy and present during all the weeks of the study has declined by 49% over the 3 weeks of outbreak going from 13 km to about 7 km on average.
-
The restrictions in mobility, closure of public spaces and the enhancement of smart/remote working, led to an average reduction of potential encounters of 8% during week 2 and almost 19% during week 3.
Our results represent a preliminary assessment of the efficacy of mitigation policies in reducing mobility and social mixing aimed at slowing the COVID-19 epidemic in Italy and can be helpful to modelers and policymakers.
Travel Restrictions and Mobility Flows
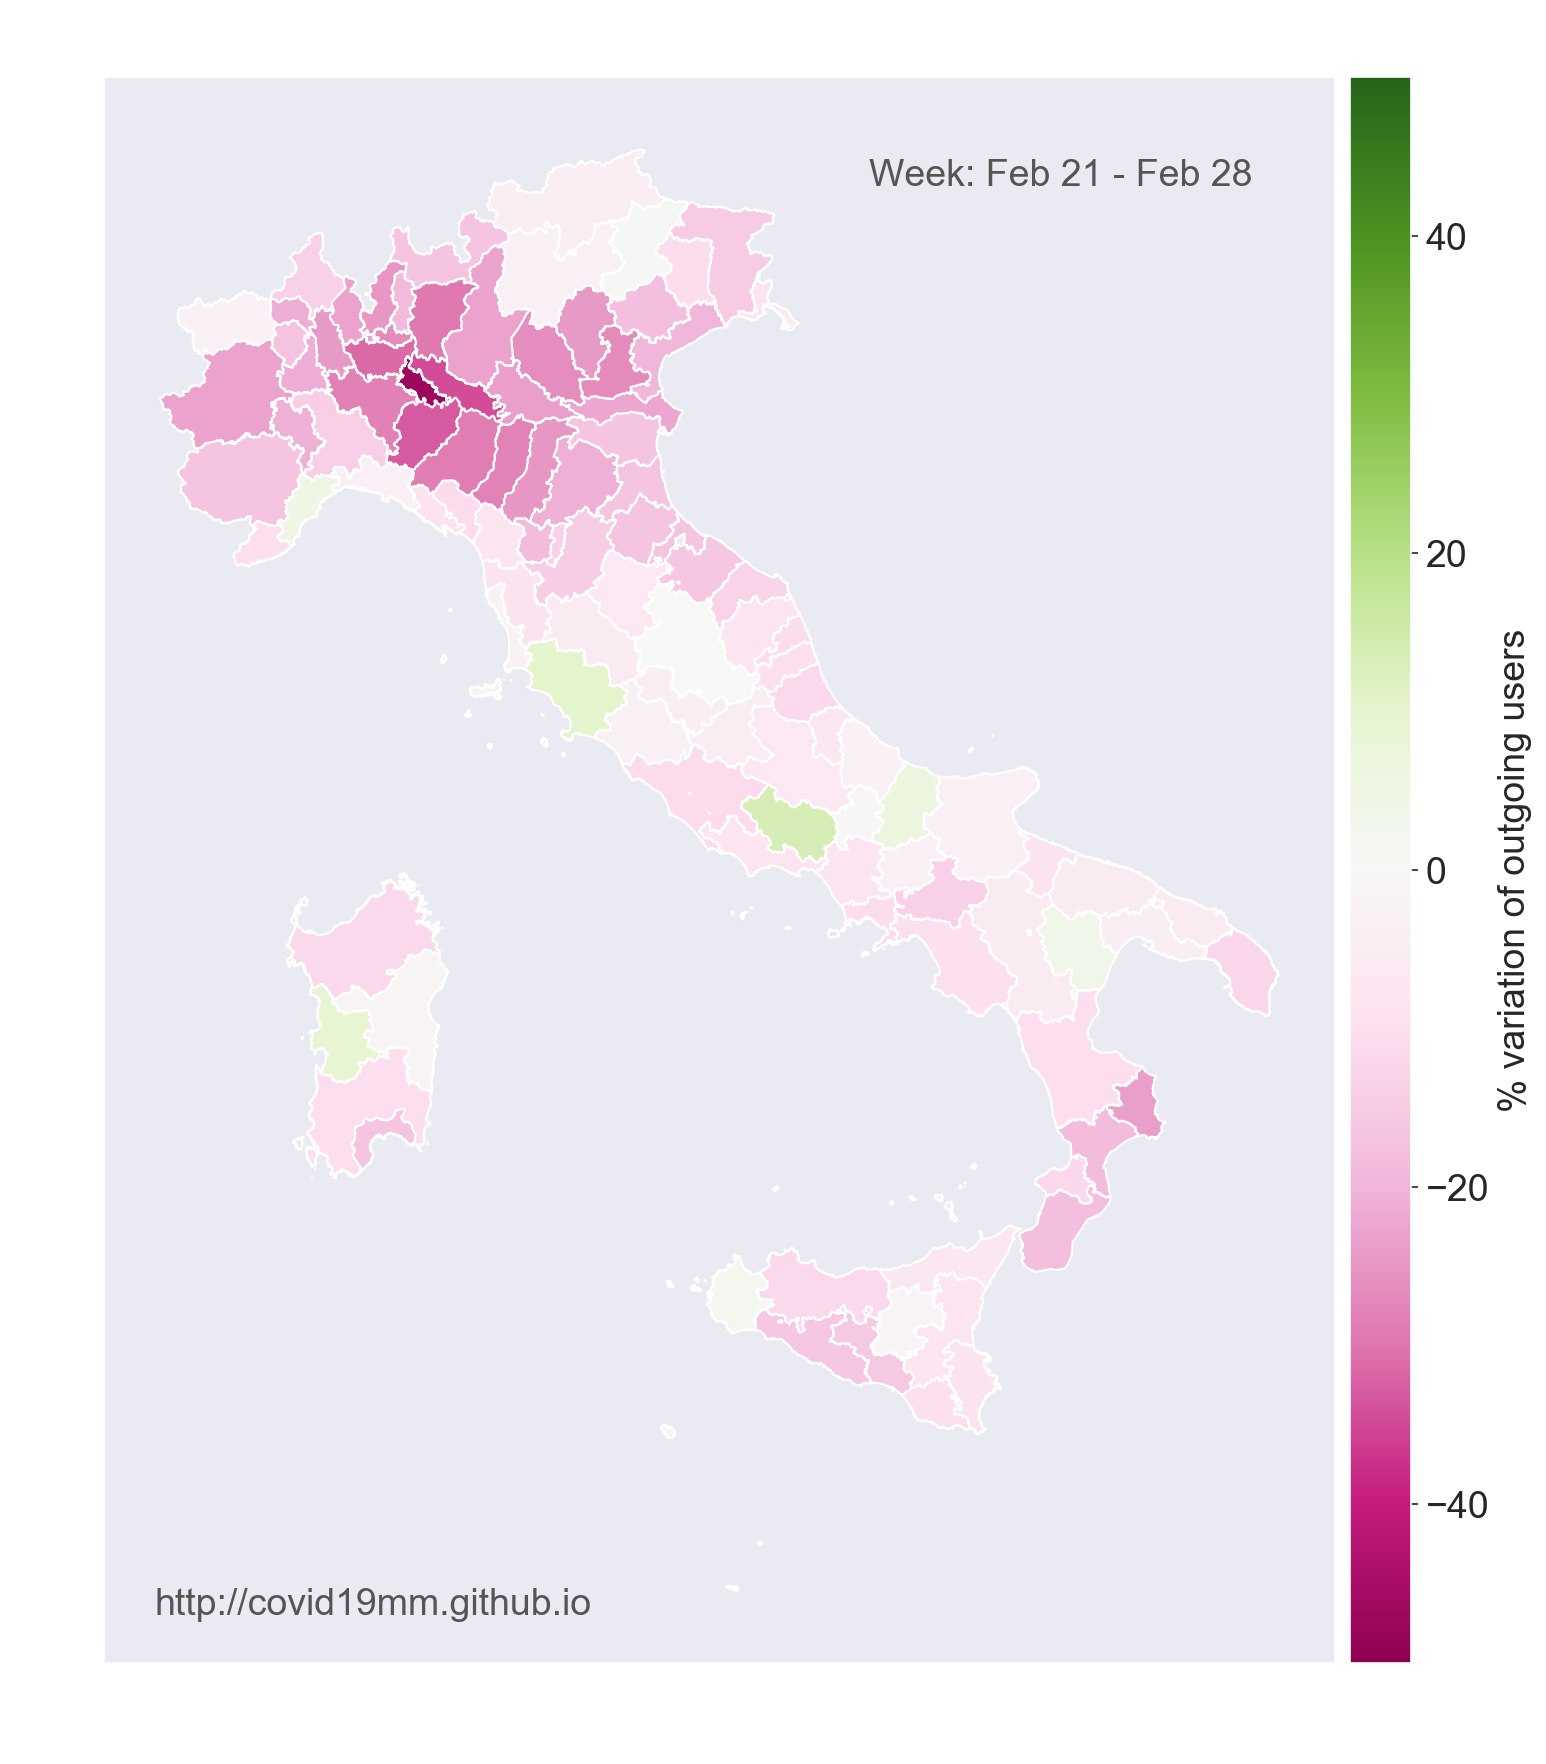
Week 1
In the week of February 22-28, we observe a marked reduction of mobility between Italian provinces especially in the area initially affected by the outbreak. The flows of users traveling out of the provinces of Lombardy, Piedmont, Emilia Romagna, and Veneto, decreased by an average of 20% as shown in the Figure below. For the provinces most affected by the outbreak (Lodi, Cremona), the traffic reduction was about 30%.
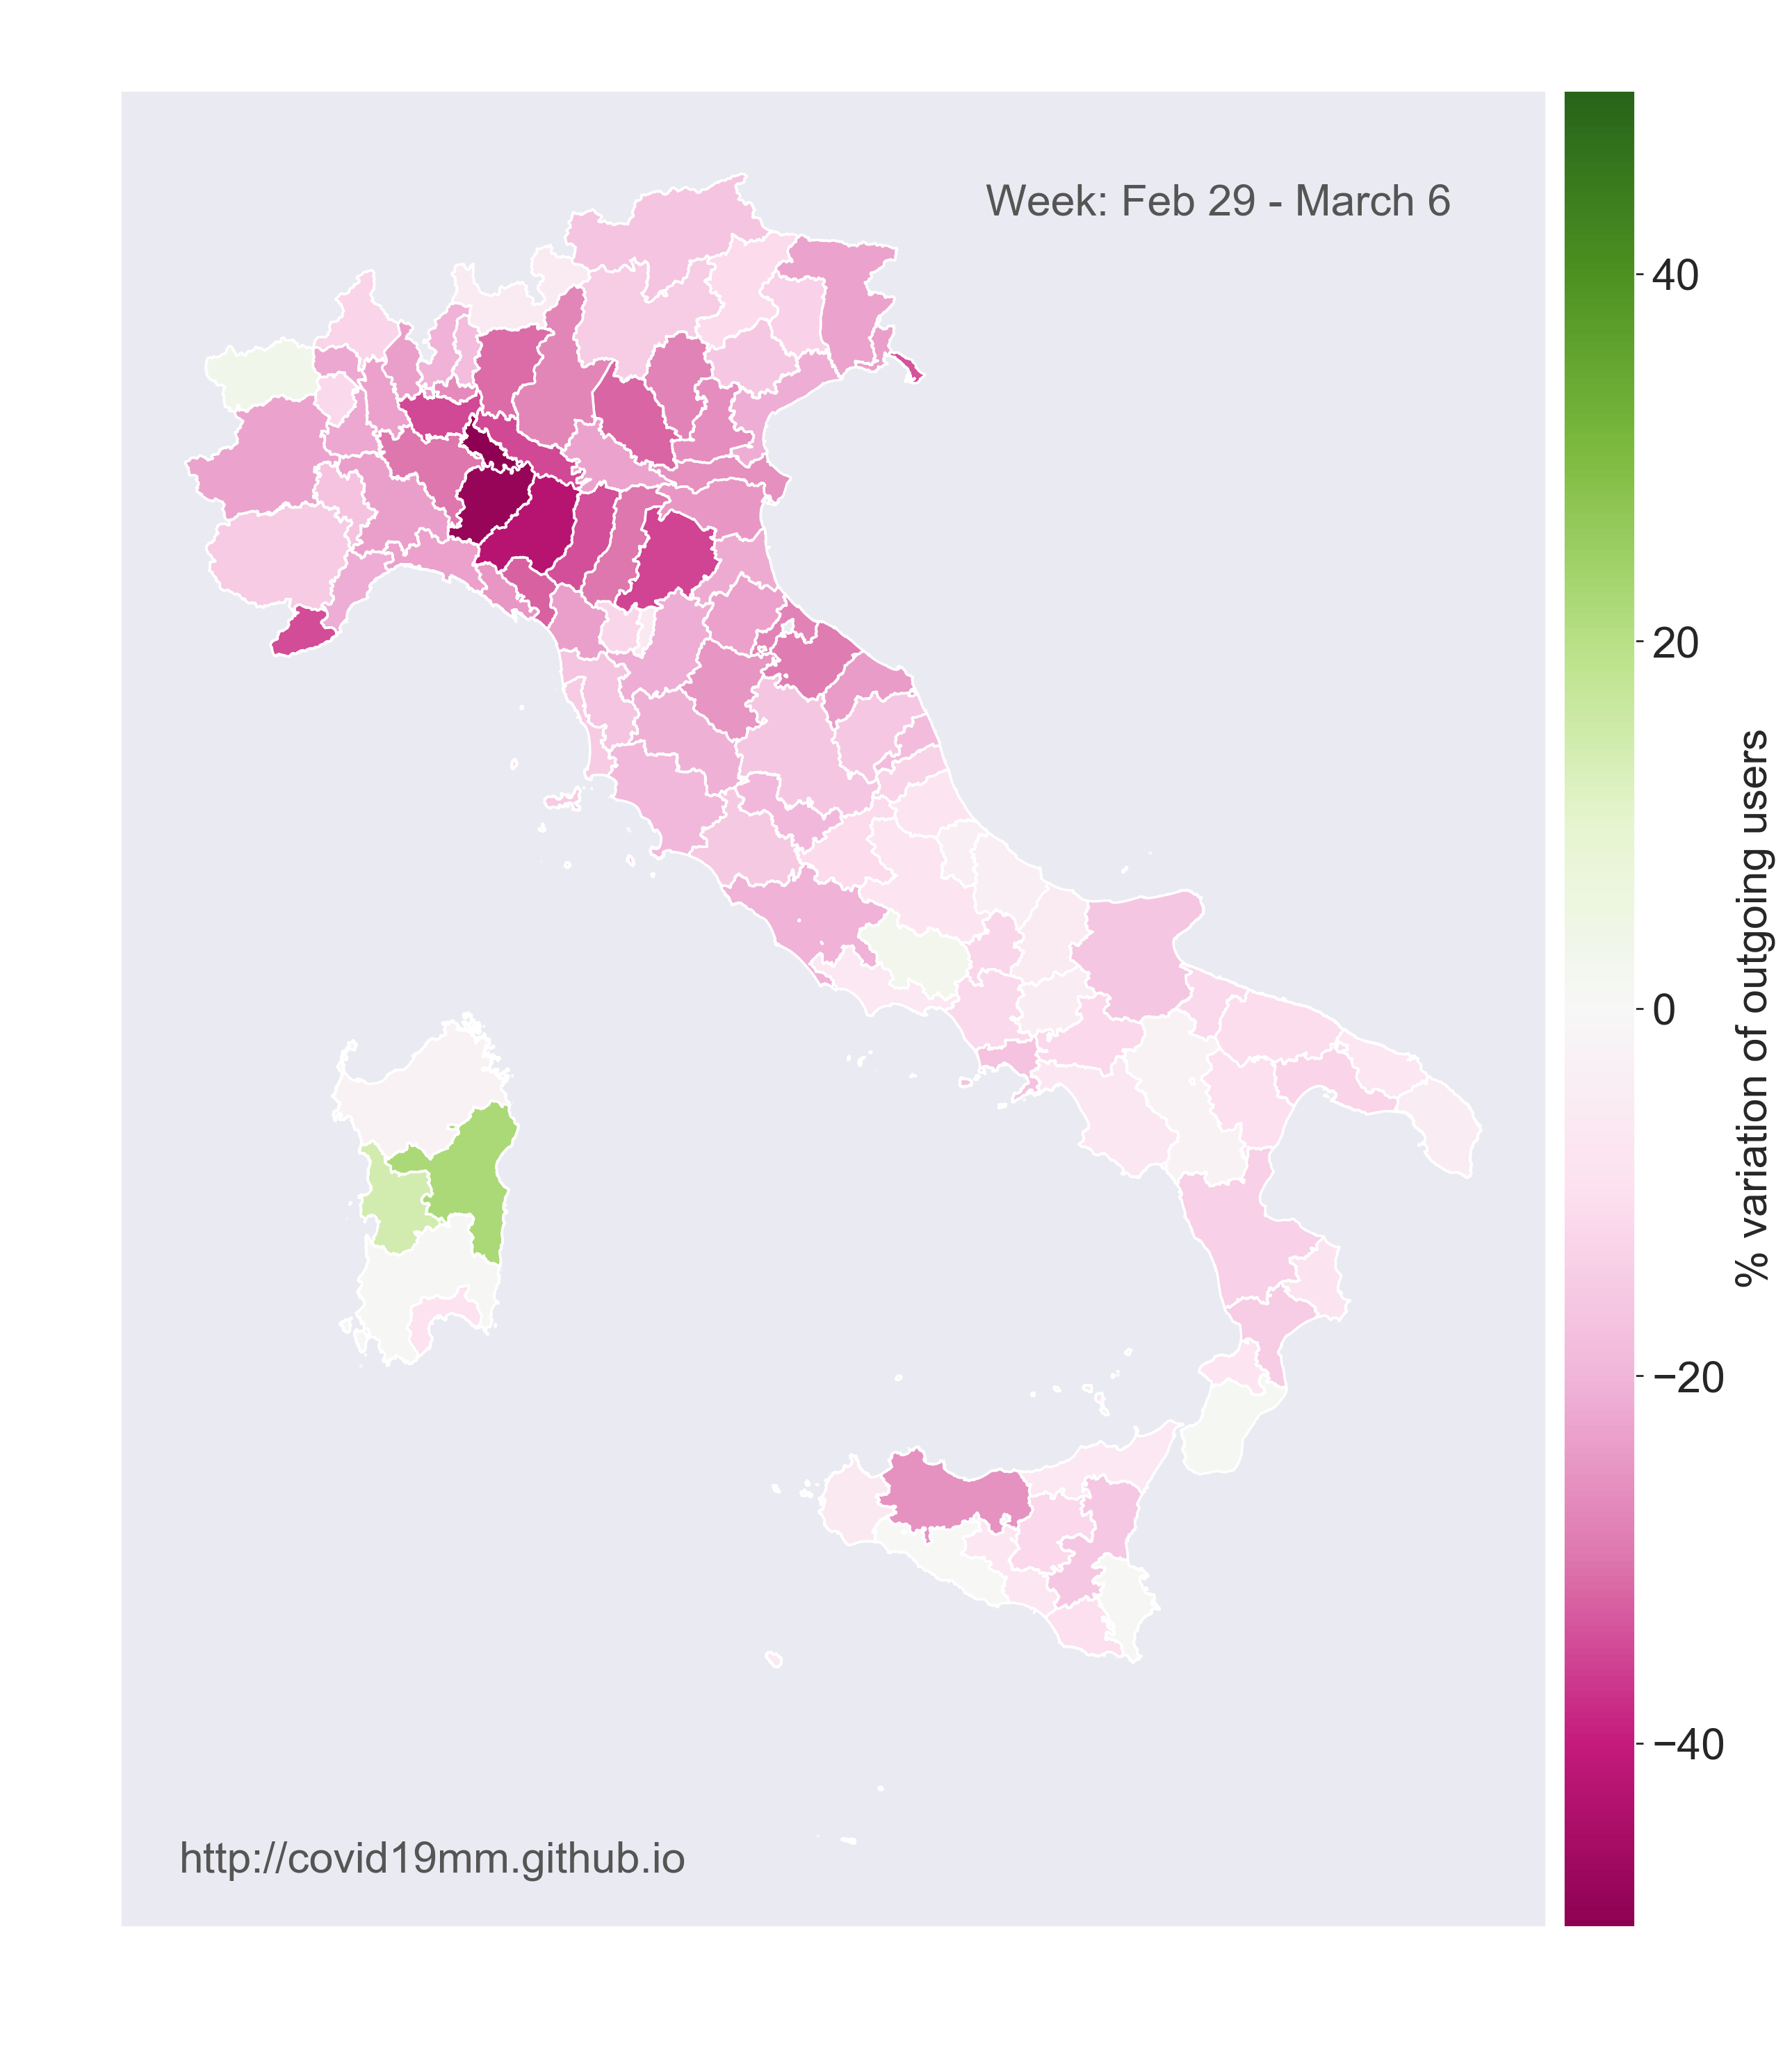
Week 2
In the week of February 29 - March 6, the mobility between provinces decreased further, especially in the provinces of Lombardy and Emilia Romagna, with reductions up to 30% in Lodi, Cremona, Parma, Piacenza, and Bologna.
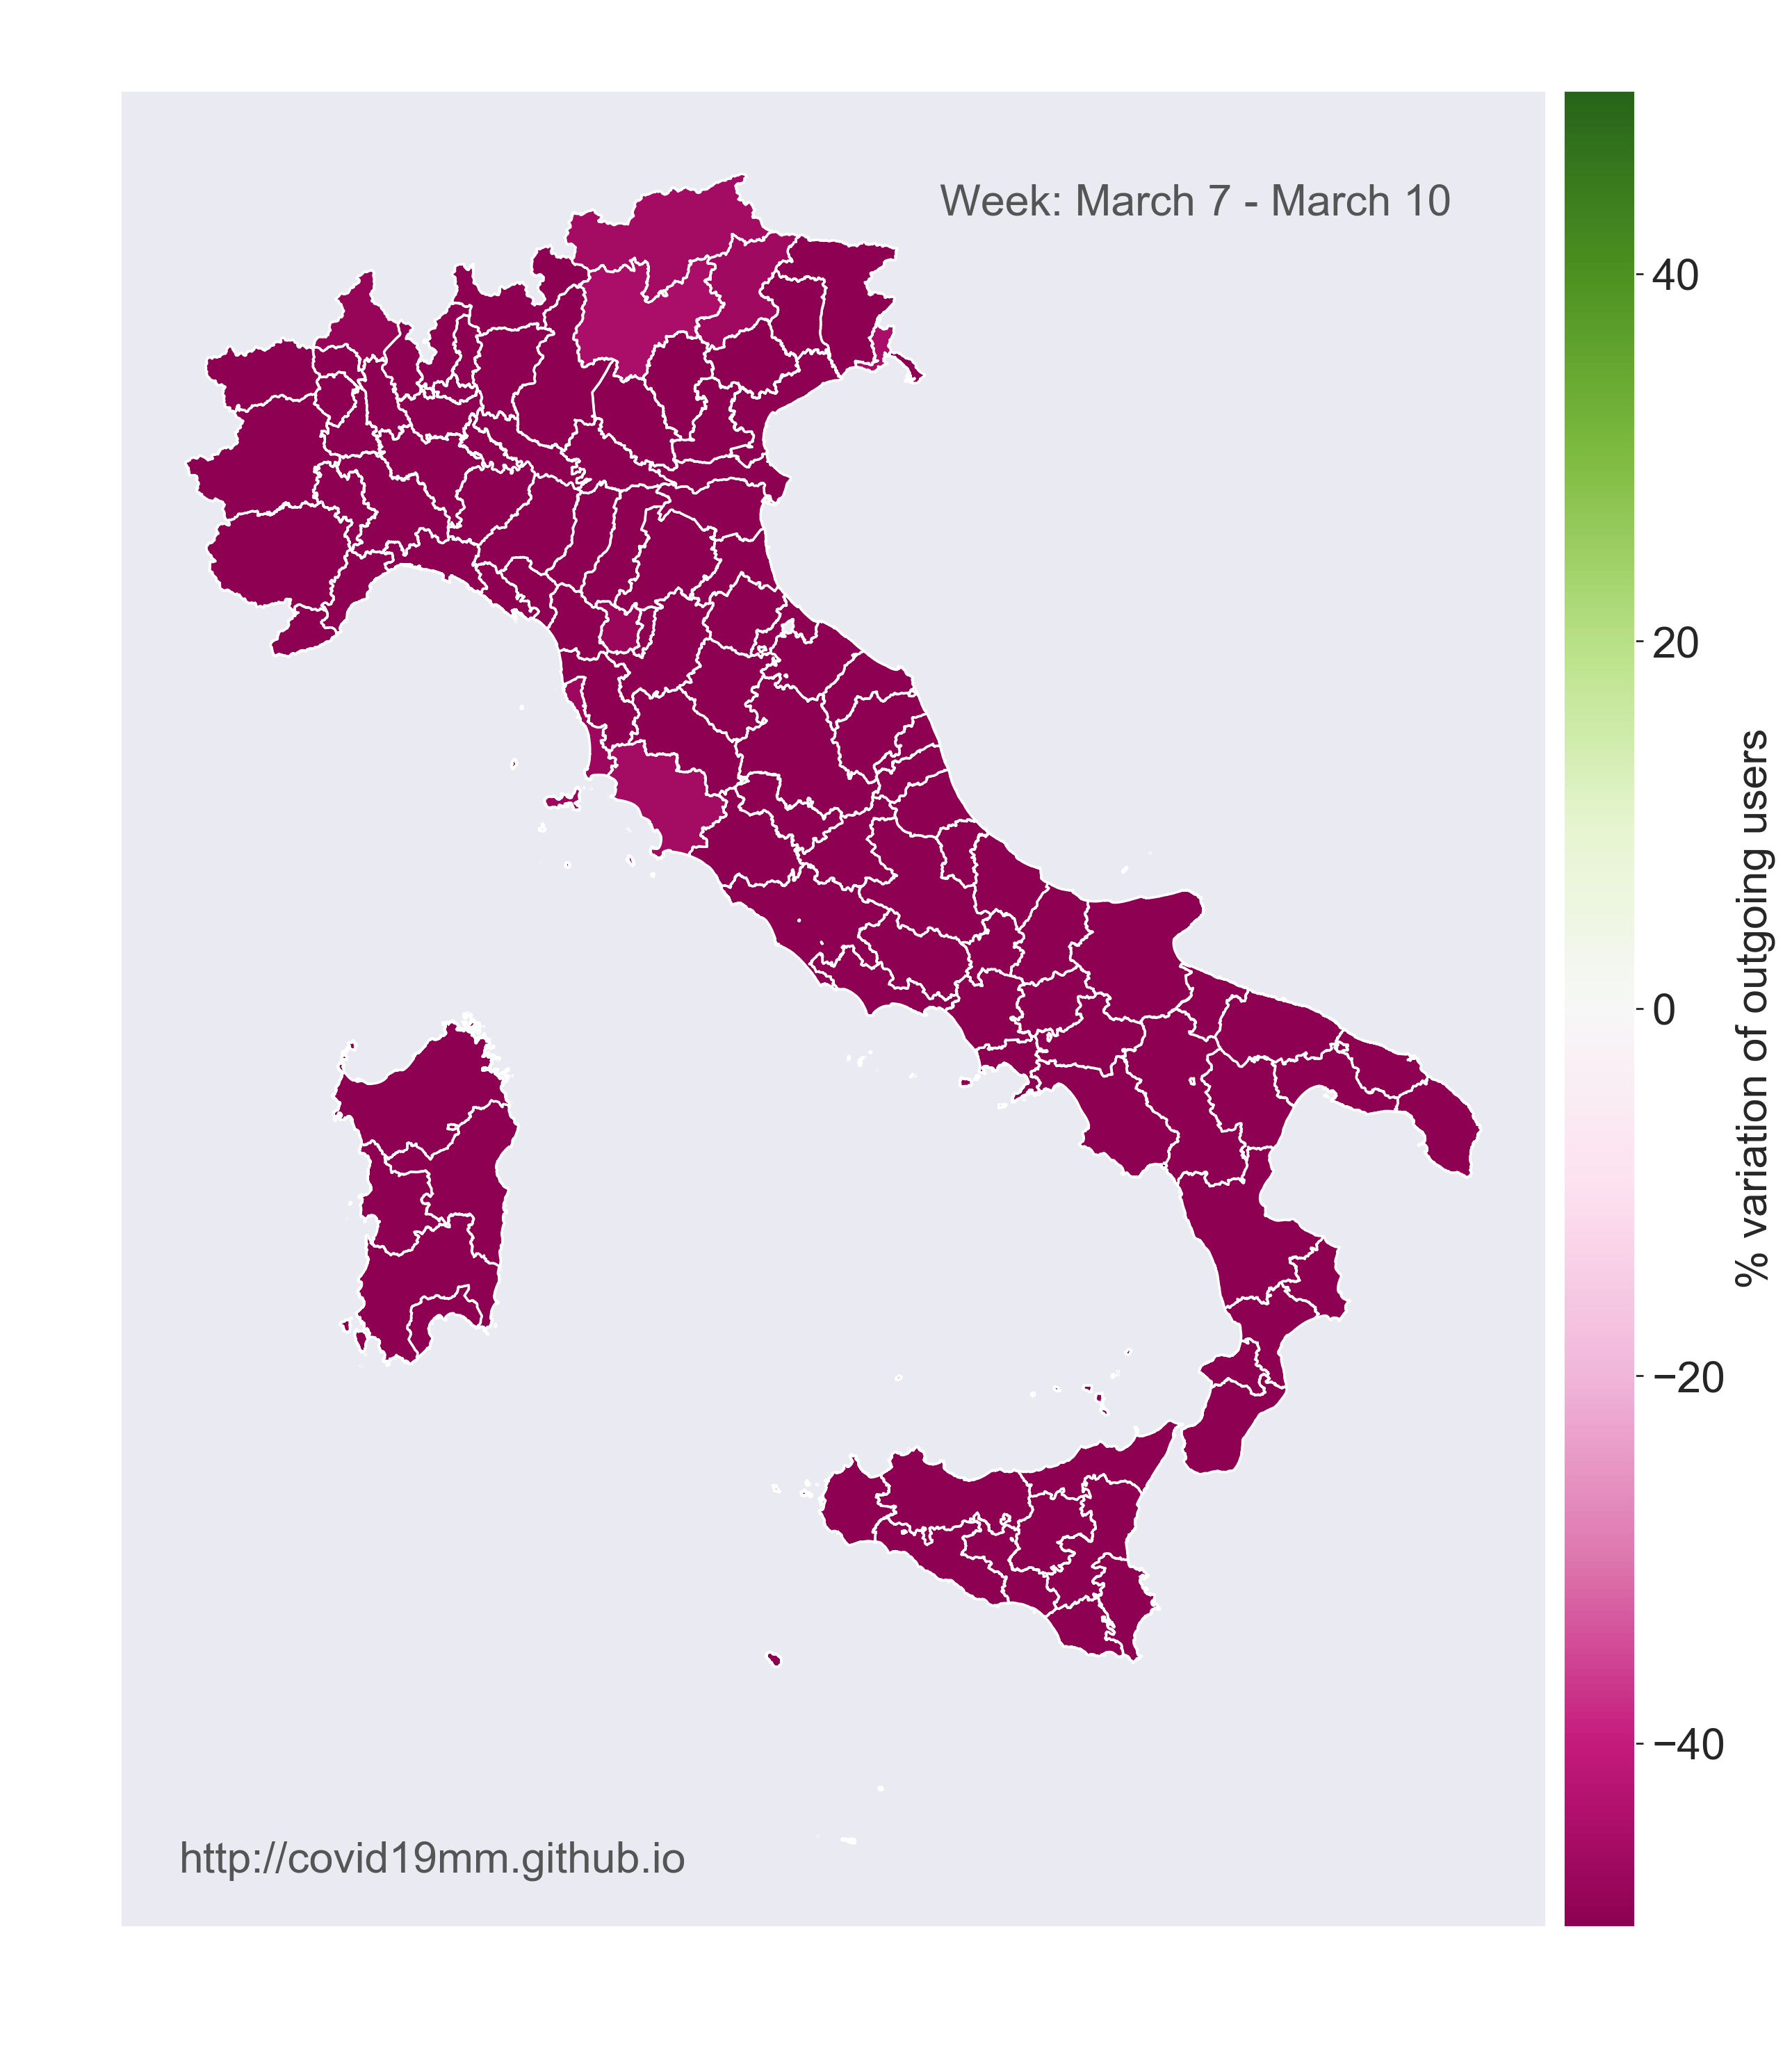
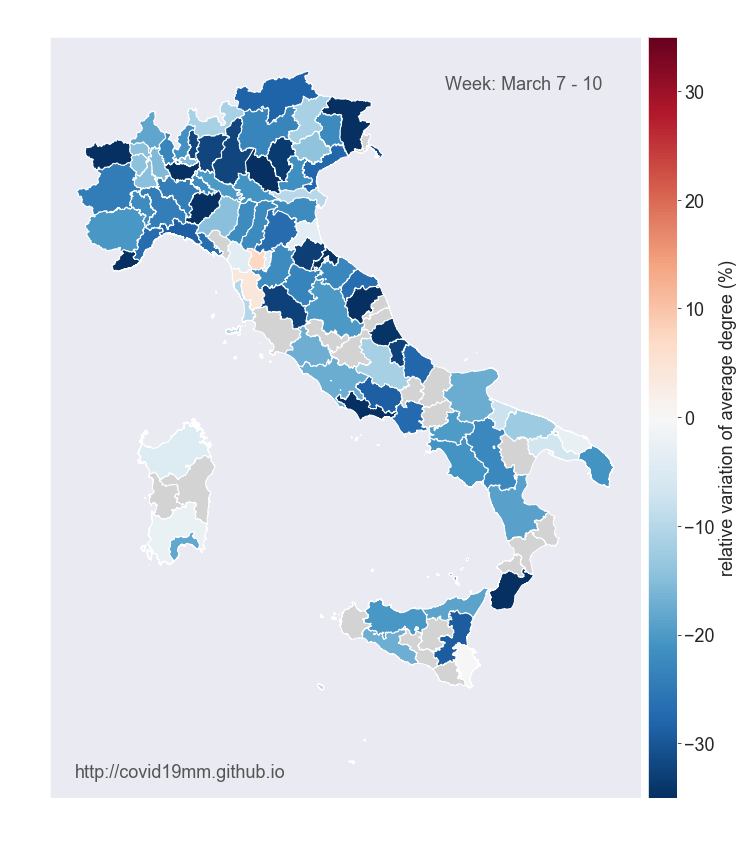
Week 3
In the week of March 7-10, following the national lockdown, we observe a 50% reduction in the movements across all Italian provinces, as shown in the map below.
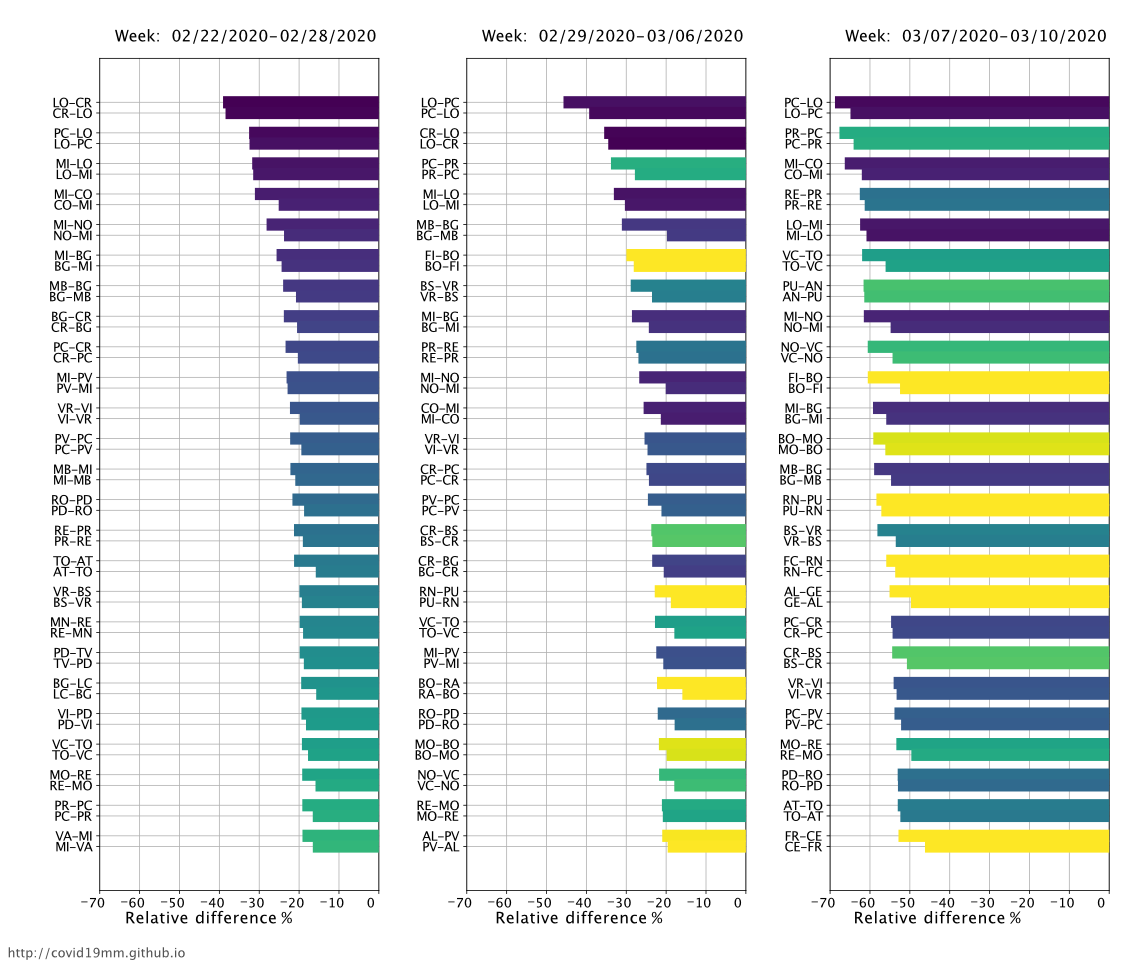
A Network Perspective
Besides the aggregated traffic of people moving from/to individual provinces, it is also possible to extract more granular network information about the fluxes of individuals traveling between pairs of provinces. Thus, weekly and daily province-to-province weighted mobility networks have been extracted. Averaging the fraction of travelers with respect to the weekly user-base on every link in the 5-weeks period before the outbreak, a baseline value has been estimated. As shown in the figure below, we observed a drop up to 40% on links connecting Lodi (where the first Italian cluster was detected), while on week 3 several connections both from Northern and Center Italy observed a drop of 50% up to 70% of their traffic.
Changes in Mixing Patterns
Beyond mobility restrictions, other public health interventions such as the ban on public events and gatherings, school closures, etc. have the goal of reducing the number of contacts among individuals in the population.
We evaluated the effect of such interventions by defining a proxy of the potential encounters each user could have in one hour. To this aim, we built a proximity network among users based on the locations they visited and the hour of the day where these visits occurred. To create such a network, we assert proximity between any two users of the same province who were seen within a circle of radius R = 50m over a 1 hour period.
To measure variations in the network structure over time, we look at the average degree of the network by computing the average ratio between the number of network links and the number of network nodes by day. Finally, we compare the average degree of the network in Week 3 against the average degree of the pre-outbreak period.
As shown in the figure below, the average degree of the users’ proximity network has decreased significantly in almost all provinces of Italy, in the week of the national lockdown (Provinces with less than 500 users are shown in grey). In some provinces (Milano, Piacenza, Rimini, and others), the average network degree has dropped about 30% with respect to the pre-outbreak period.
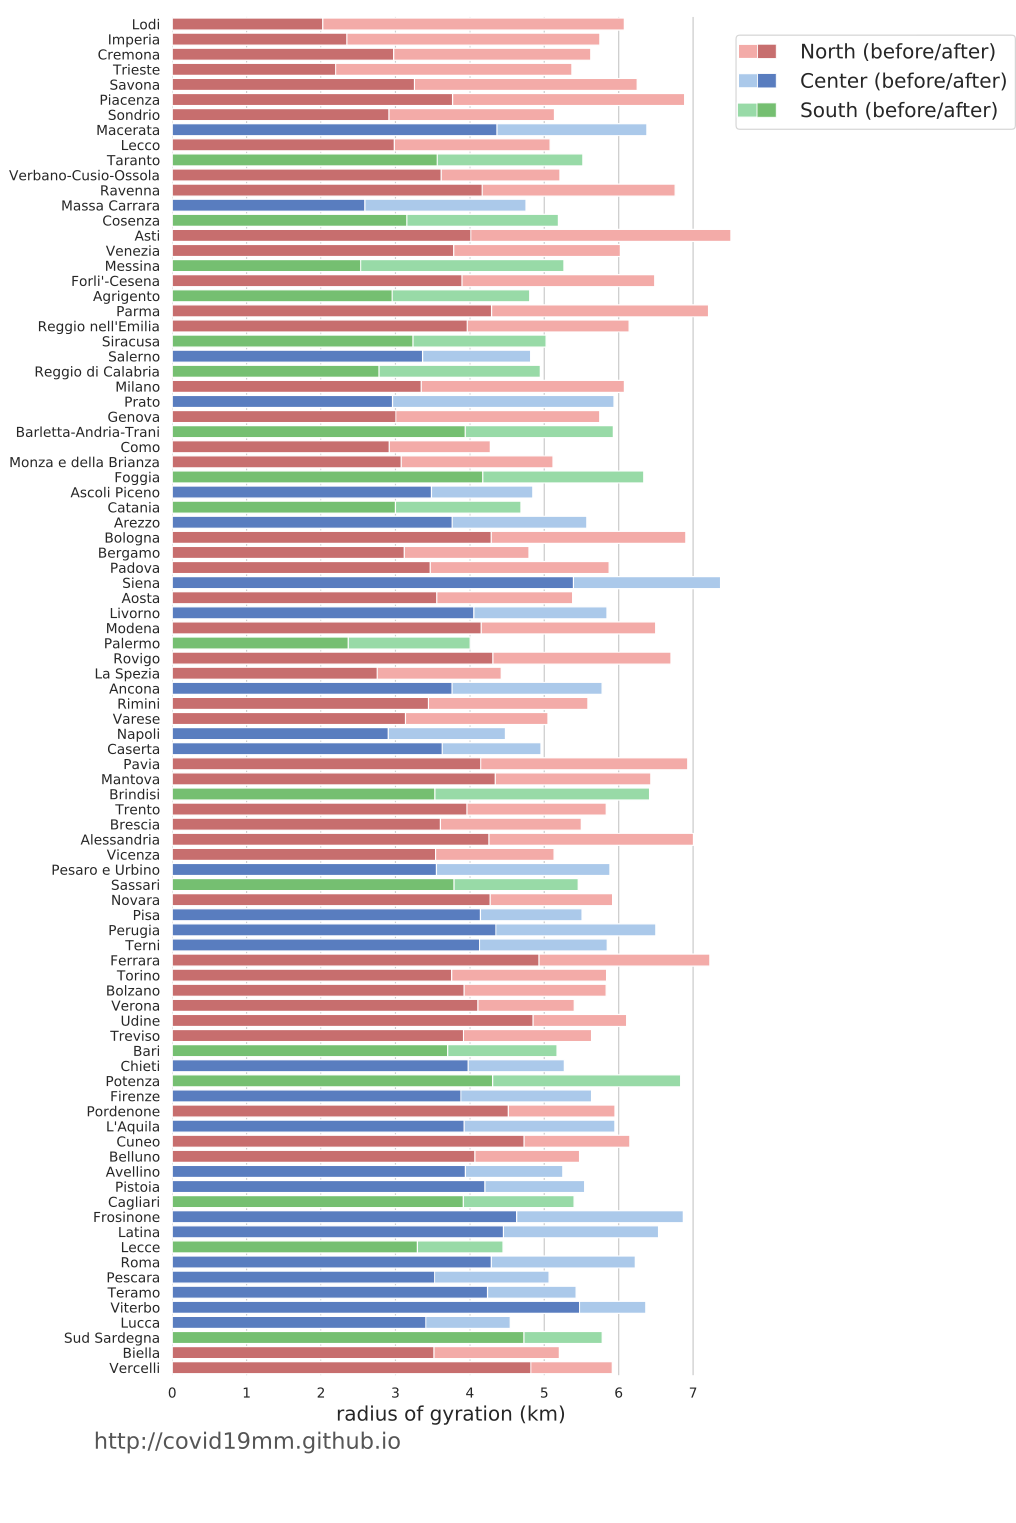
Changes in Individual Mobility
Heterogeneity in individual mobility can be captured by different mobility metrics. Here, to estimate the characteristic distance traveled by users before and after the outbreak, we computed the radius of gyration of the same population during the weeks before the restrictions and the 3 following weeks. Before the COVID-19 outbreak, half of the population was traveling more than 5.7 km a week while on the third week of restrictions, half of the population travel less than 2 km a week. After identifying the province of residence of the users (the province of residence is defined as the province in which the majority of data points of the user was recorded during the night), we computed the median radius of gyration of the population in each province.
While the largest drops in the radius of gyration are mainly observed in the North during the first 2 weeks of restrictions, we observe a more homogeneous drop all over the country, after the national lockdown.
Week 1
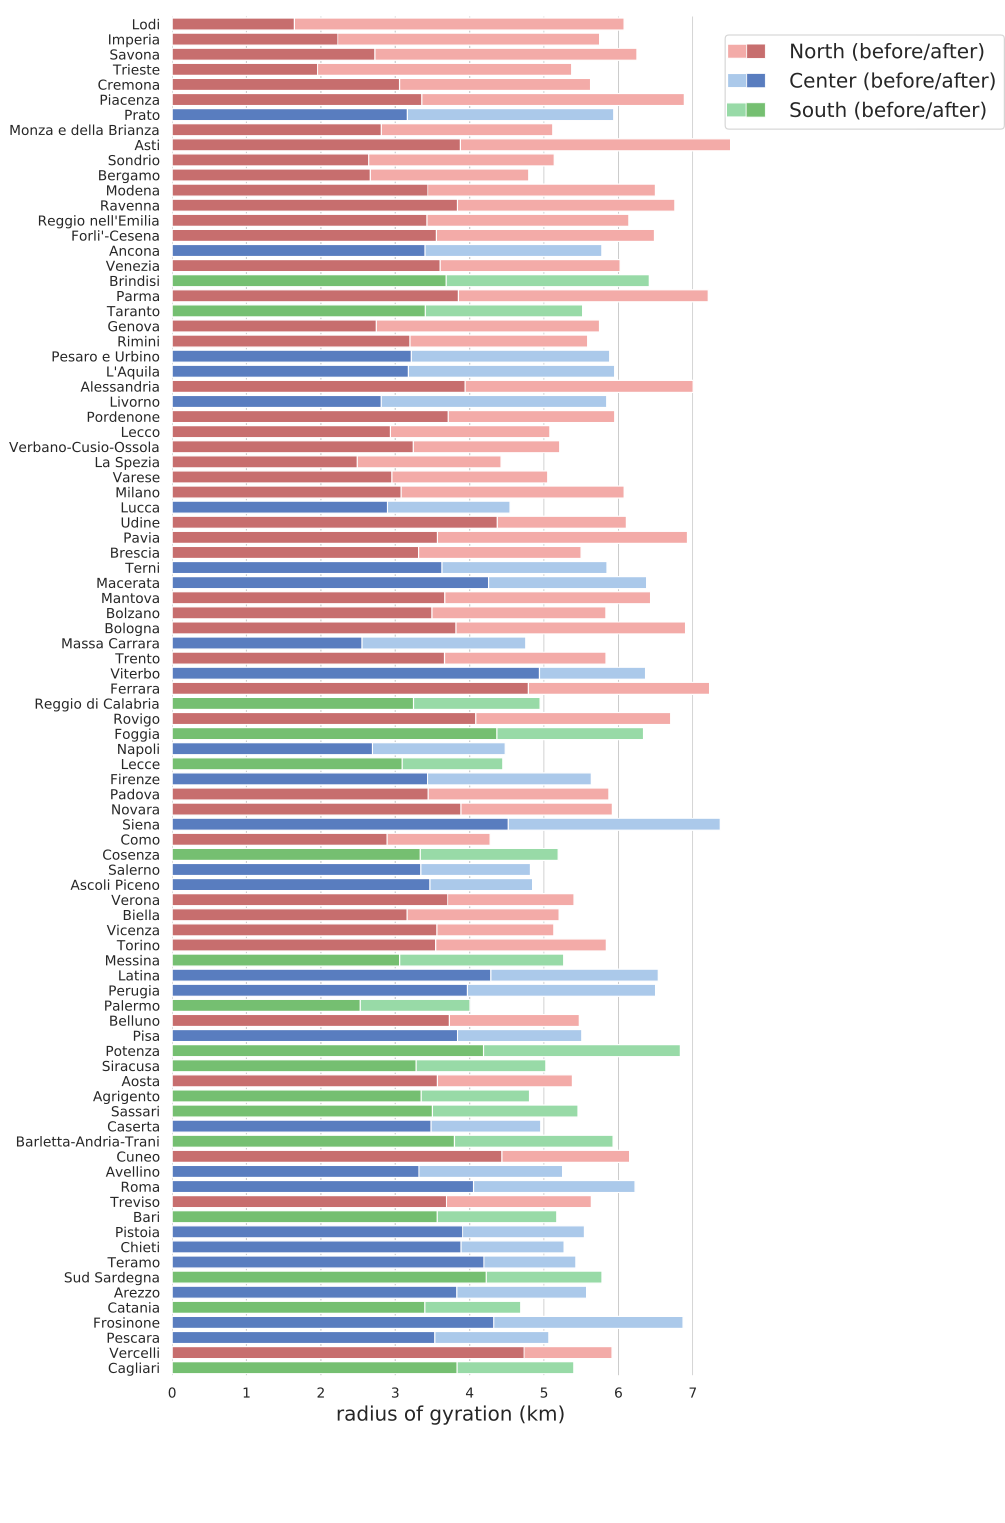
Week 2
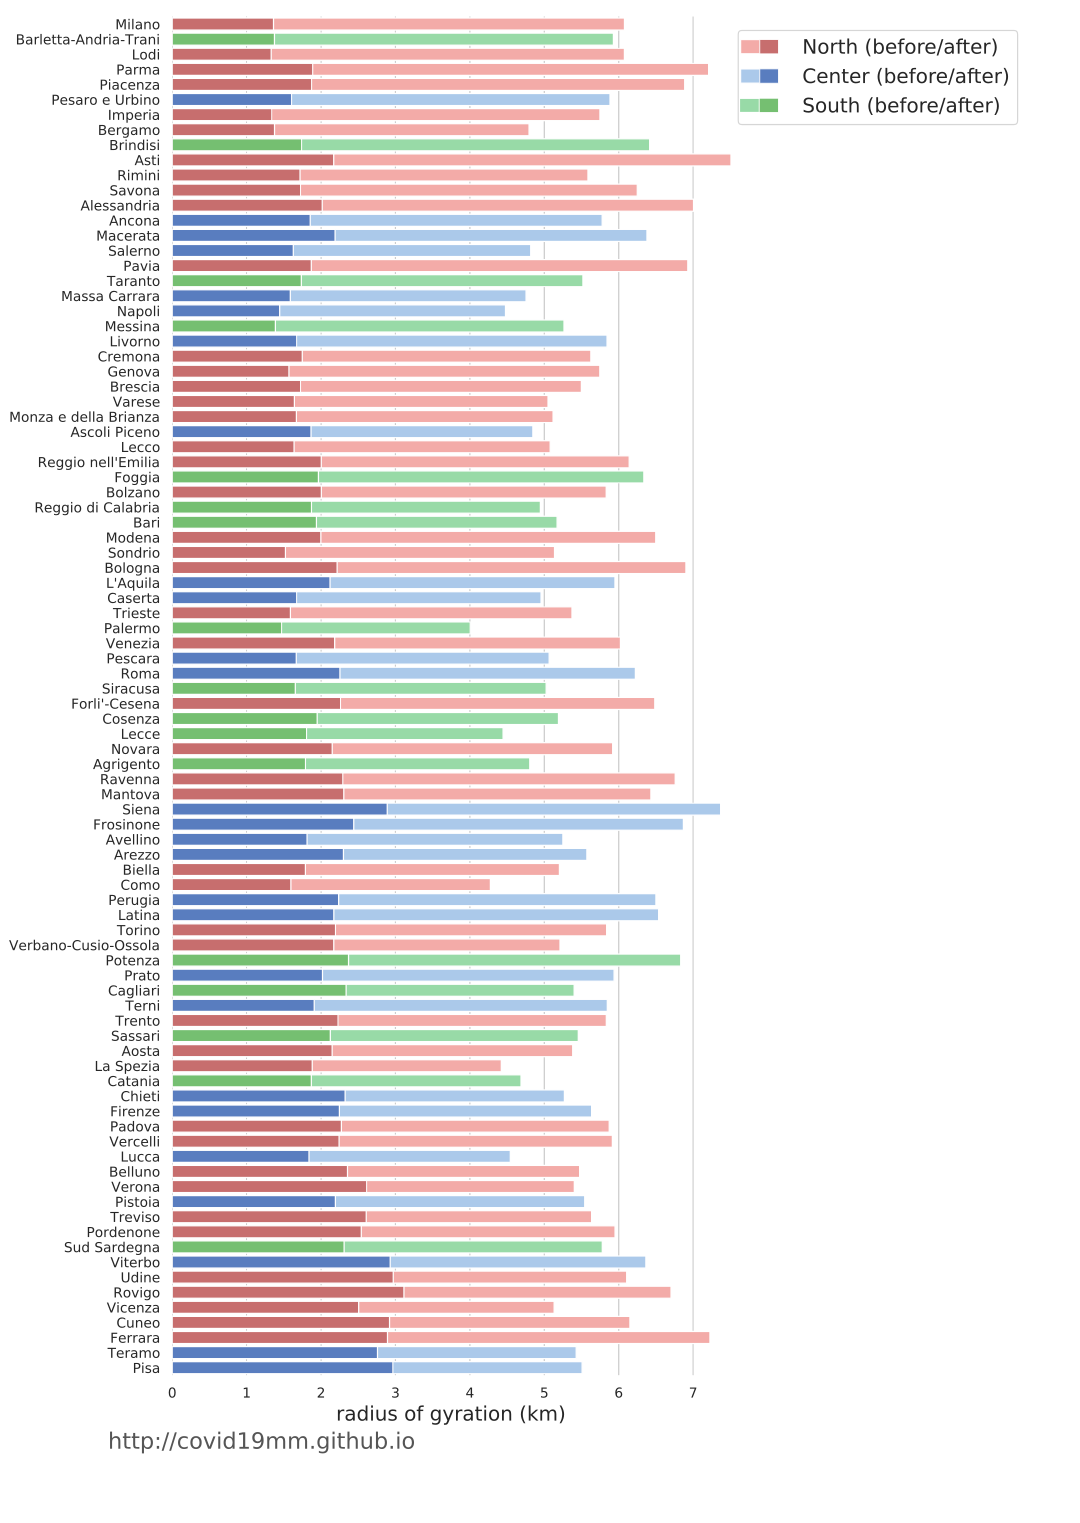
Week 3
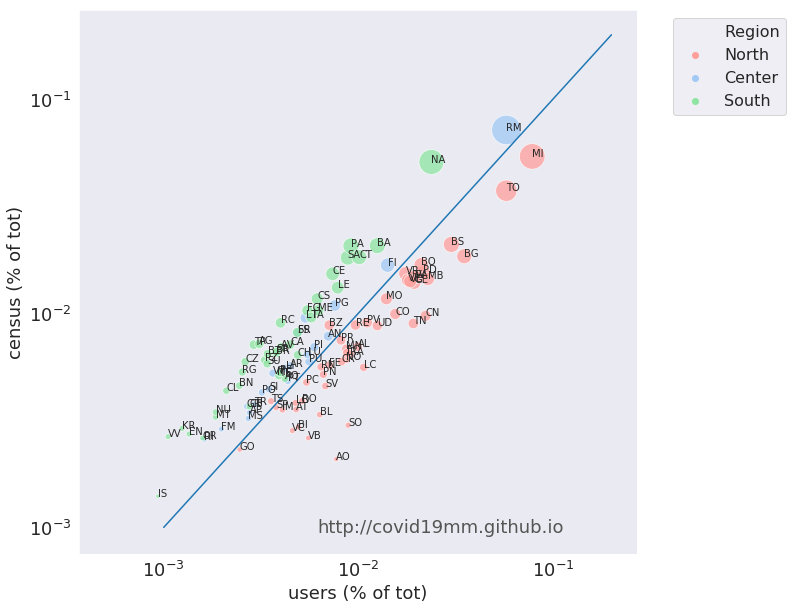
Sample Representativeness
To test the representativeness of our sample, we compared the size of the users’ sample with the census population by province. The figure below shows a scatterplot of the two populations as % of the total, by province. The size of the dots is proportional to the population size. The Pearson population-weighted correlation coefficient between the two datasets is r = 0.85.
Data Protection
This research was solely based on data from anonymized users who have opted-in to provide access to their location data anonymously, through a GDPR-compliant framework. The analysis never singled out identifiable individuals and no attempts were made to link these data to third party data about an individual. In order to preserve privacy, residential areas are inferred at an aggregated geohash level, thereby allowing for demographic analysis while obfuscating the true home location of anonymous users and prohibiting misuse of data.
Acknowledgments and Partnerships
This preliminary analysis is a collaboration between the ISI Foundation and Cuebiq Inc. Authors at ISI Foundation acknowledge support from the Lagrange Project funded by CRT Foundation and thank Cuebiq for access to a de-identified sample of its mobility data. In response to the COVID-19 crisis, Cuebiq is providing insights to academic and humanitarian groups through a multi-stakeholder data collaborative for timely and ethical analysis of aggregate human mobility patterns.